Copyright
©2010 Baishideng.
World J Gastroenterol. Aug 21, 2010; 16(31): 3888-3896
Published online Aug 21, 2010. doi: 10.3748/wjg.v16.i31.3888
Published online Aug 21, 2010. doi: 10.3748/wjg.v16.i31.3888
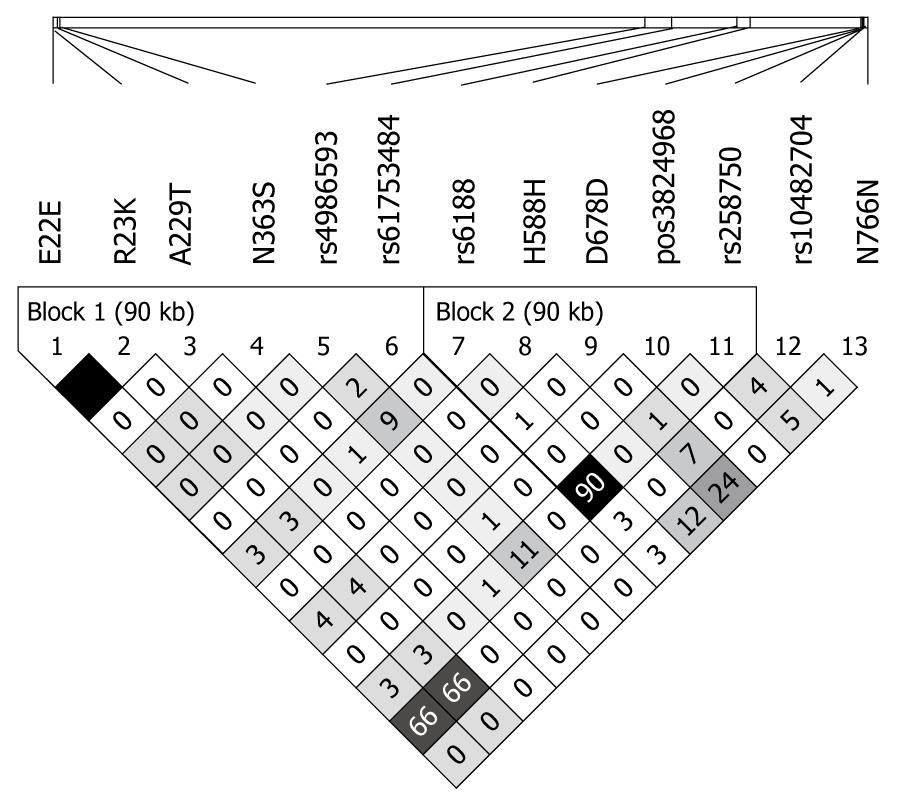
Figure 3 Linkage disequilibrium calculations of single nucleotide polymorphisms in the NR3C1 gene.
Linkage disequilibrium plot of r2 values of observed variants in the N3RC1 gene. Colour scheme: r2 = 0%, white, 0% < r2 < 100%, shades of grey, r2 = 100%, black.
- Citation: Mwinyi J, Wenger C, Eloranta JJ, Kullak-Ublick GA. Glucocorticoid receptor gene haplotype structure and steroid therapy outcome in IBD patients. World J Gastroenterol 2010; 16(31): 3888-3896
- URL: https://www.wjgnet.com/1007-9327/full/v16/i31/3888.htm
- DOI: https://dx.doi.org/10.3748/wjg.v16.i31.3888


