Copyright
©2010 Baishideng.
World J Gastroenterol. Aug 7, 2010; 16(29): 3651-3663
Published online Aug 7, 2010. doi: 10.3748/wjg.v16.i29.3651
Published online Aug 7, 2010. doi: 10.3748/wjg.v16.i29.3651
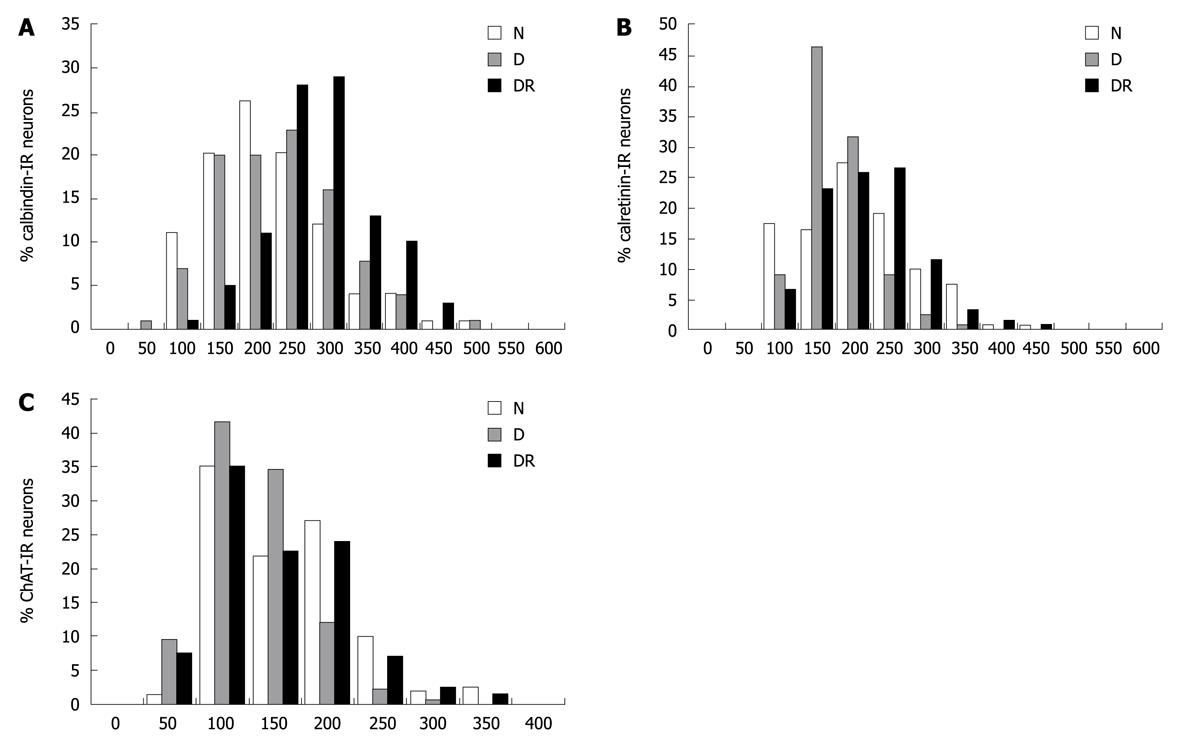
Figure 8 Histogram showing the distribution of areas (μm2) of neurons immunoreactive for calbindin (A), calretinin (B) and choline acetyltransferase (C) in the ileal submucosal plexus of the N, D and DR groups.
ChAT: Choline acetyltransferase.
- Citation: Misawa R, Girotti PA, Mizuno MS, Liberti EA, Furness JB, Castelucci P. Effects of protein deprivation and re-feeding on P2X2 receptors in enteric neurons. World J Gastroenterol 2010; 16(29): 3651-3663
- URL: https://www.wjgnet.com/1007-9327/full/v16/i29/3651.htm
- DOI: https://dx.doi.org/10.3748/wjg.v16.i29.3651


