Copyright
©2010 Baishideng.
World J Gastroenterol. Jul 28, 2010; 16(28): 3529-3540
Published online Jul 28, 2010. doi: 10.3748/wjg.v16.i28.3529
Published online Jul 28, 2010. doi: 10.3748/wjg.v16.i28.3529
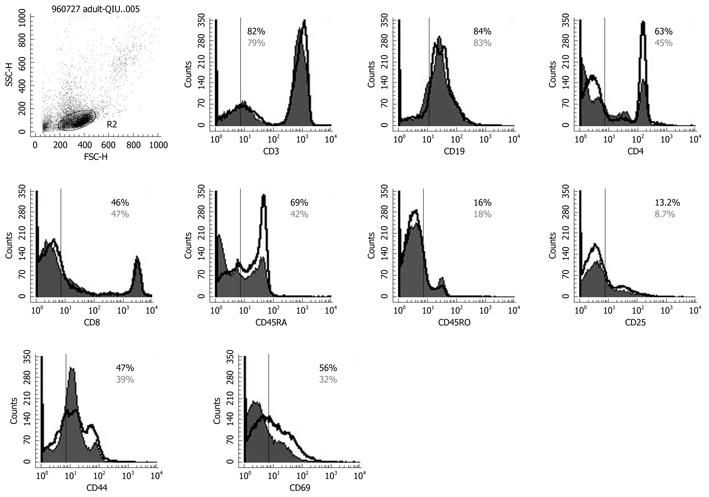
Figure 6 Flow cytometry results for CD3, CD4, CD45RA, CD45RO, CD8, CD19, CD25, CD44, CD69 expression on peripheral lymphocytes.
The solid histogram shows the results for controls, and the unshaded area shows the level of expression of co-stimulatory molecules after Bio-Three treatment. The data shown are representative of three experiments performed. Bio-Three might alter the expression of T-cell surface phenotype, such as CD4, C45RA, CD44, CD69, and even CD25.
- Citation: Hua MC, Lin TY, Lai MW, Kong MS, Chang HJ, Chen CC. Probiotic Bio-Three induces Th1 and anti-inflammatory effects in PBMC and dendritic cells. World J Gastroenterol 2010; 16(28): 3529-3540
- URL: https://www.wjgnet.com/1007-9327/full/v16/i28/3529.htm
- DOI: https://dx.doi.org/10.3748/wjg.v16.i28.3529


