Copyright
©2010 Baishideng.
World J Gastroenterol. Jul 28, 2010; 16(28): 3491-3498
Published online Jul 28, 2010. doi: 10.3748/wjg.v16.i28.3491
Published online Jul 28, 2010. doi: 10.3748/wjg.v16.i28.3491
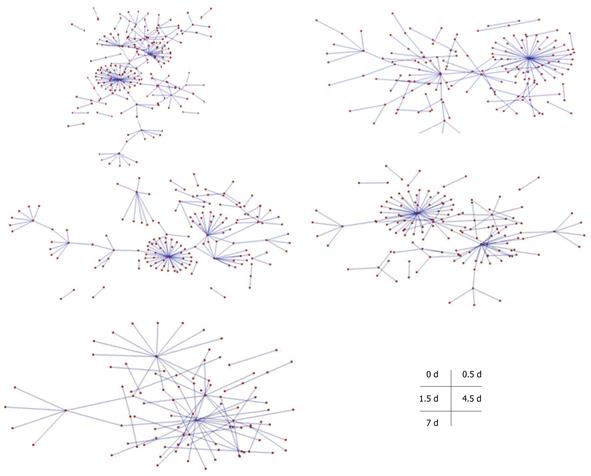
Figure 5 A protein-protein interaction map of transcription factors associated with liver cell proliferation.
Node stands for protein and the edge means the two proteins are interactive; the node size symbolizes the degree of this protein (the more highly connected with others, the bigger node); the edge target arrow shape and color: delta and blue, interactions are only validated by yeast two-hybrid (Y2H); diamond and green means validated by Y2H and α-glutathione S-transferase pull-down; T and black means validated by Y2H and co-immunoprecipitation.
- Citation: Xie C, Gao J, Zhu RZ, Yuan YS, He HL, Huang QS, Han W, Yu Y. Protein-protein interaction map is a key gateway into liver regeneration. World J Gastroenterol 2010; 16(28): 3491-3498
- URL: https://www.wjgnet.com/1007-9327/full/v16/i28/3491.htm
- DOI: https://dx.doi.org/10.3748/wjg.v16.i28.3491


