Copyright
©2010 Baishideng.
World J Gastroenterol. Jun 21, 2010; 16(23): 2918-2925
Published online Jun 21, 2010. doi: 10.3748/wjg.v16.i23.2918
Published online Jun 21, 2010. doi: 10.3748/wjg.v16.i23.2918
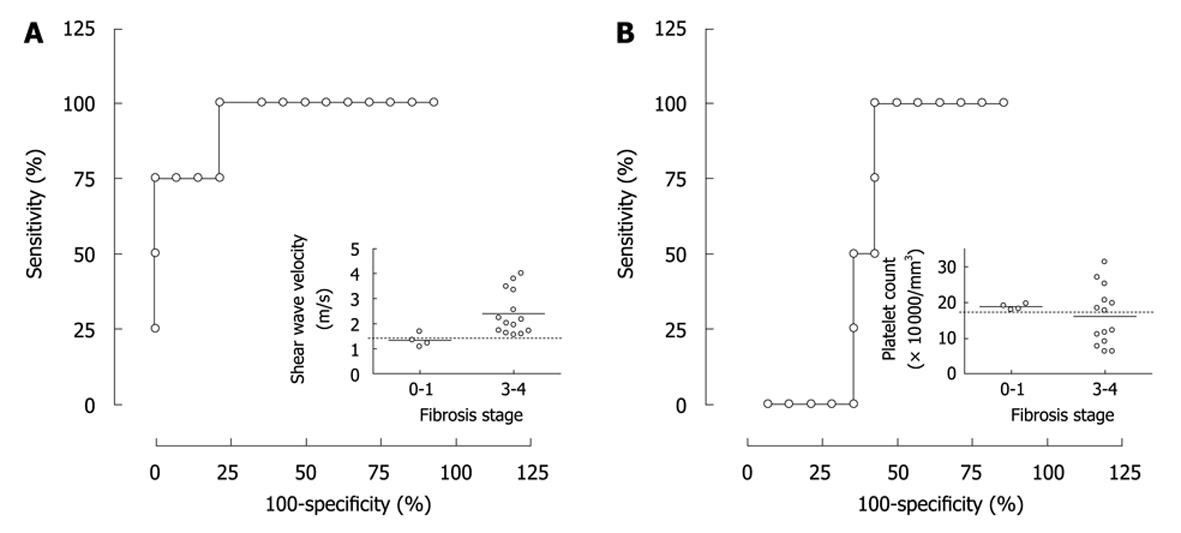
Figure 3 Receiver-operator characteristic curve (ROC) of SWV or platelet count to distinguish fibrosis stages 3 and 4 from stage 0-1.
ROC to discriminate fibrosis stages 3 and 4 from stage 0-1 by SWV (A) or platelet count (B) revealed sensitivity, specificity and area under ROC of 100%, 75% and 94.2%, or 100%, 57.1% and 61%, respectively, when 1.47 m/s or 17.8 × 10 000/mm3 was selected as a cutoff value. A small graph incorporated in each ROC graph shows the distribution of SWV or platelet count in fibrosis stages 0-1 and 3-4. The dotted line indicates the cut-off value selected.
- Citation: Osaki A, Kubota T, Suda T, Igarashi M, Nagasaki K, Tsuchiya A, Yano M, Tamura Y, Takamura M, Kawai H, Yamagiwa S, Kikuchi T, Nomoto M, Aoyagi Y. Shear wave velocity is a useful marker for managing nonalcoholic steatohepatitis. World J Gastroenterol 2010; 16(23): 2918-2925
- URL: https://www.wjgnet.com/1007-9327/full/v16/i23/2918.htm
- DOI: https://dx.doi.org/10.3748/wjg.v16.i23.2918


