Copyright
©2010 Baishideng.
World J Gastroenterol. Jun 21, 2010; 16(23): 2851-2866
Published online Jun 21, 2010. doi: 10.3748/wjg.v16.i23.2851
Published online Jun 21, 2010. doi: 10.3748/wjg.v16.i23.2851
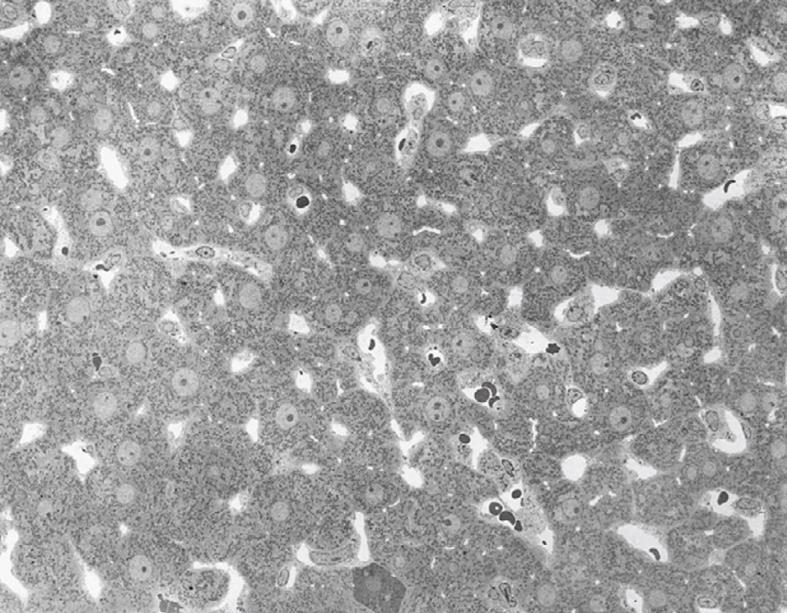
Figure 19 TEM image after perfusion fixation of rat liver through the portal vein, which results in an image of parenchymal cells of equal density (with one exception in the low middle part), open sinusoids and open bile capillaries.
Original magnification 720 ×.
- Citation: Wisse E, Braet F, Duimel H, Vreuls C, Koek G, Olde Damink SW, van den Broek MA, De Geest B, Dejong CH, Tateno C, Frederik P. Fixation methods for electron microscopy of human and other liver. World J Gastroenterol 2010; 16(23): 2851-2866
- URL: https://www.wjgnet.com/1007-9327/full/v16/i23/2851.htm
- DOI: https://dx.doi.org/10.3748/wjg.v16.i23.2851


