Copyright
©2010 Baishideng.
World J Gastroenterol. Jun 7, 2010; 16(21): 2657-2663
Published online Jun 7, 2010. doi: 10.3748/wjg.v16.i21.2657
Published online Jun 7, 2010. doi: 10.3748/wjg.v16.i21.2657
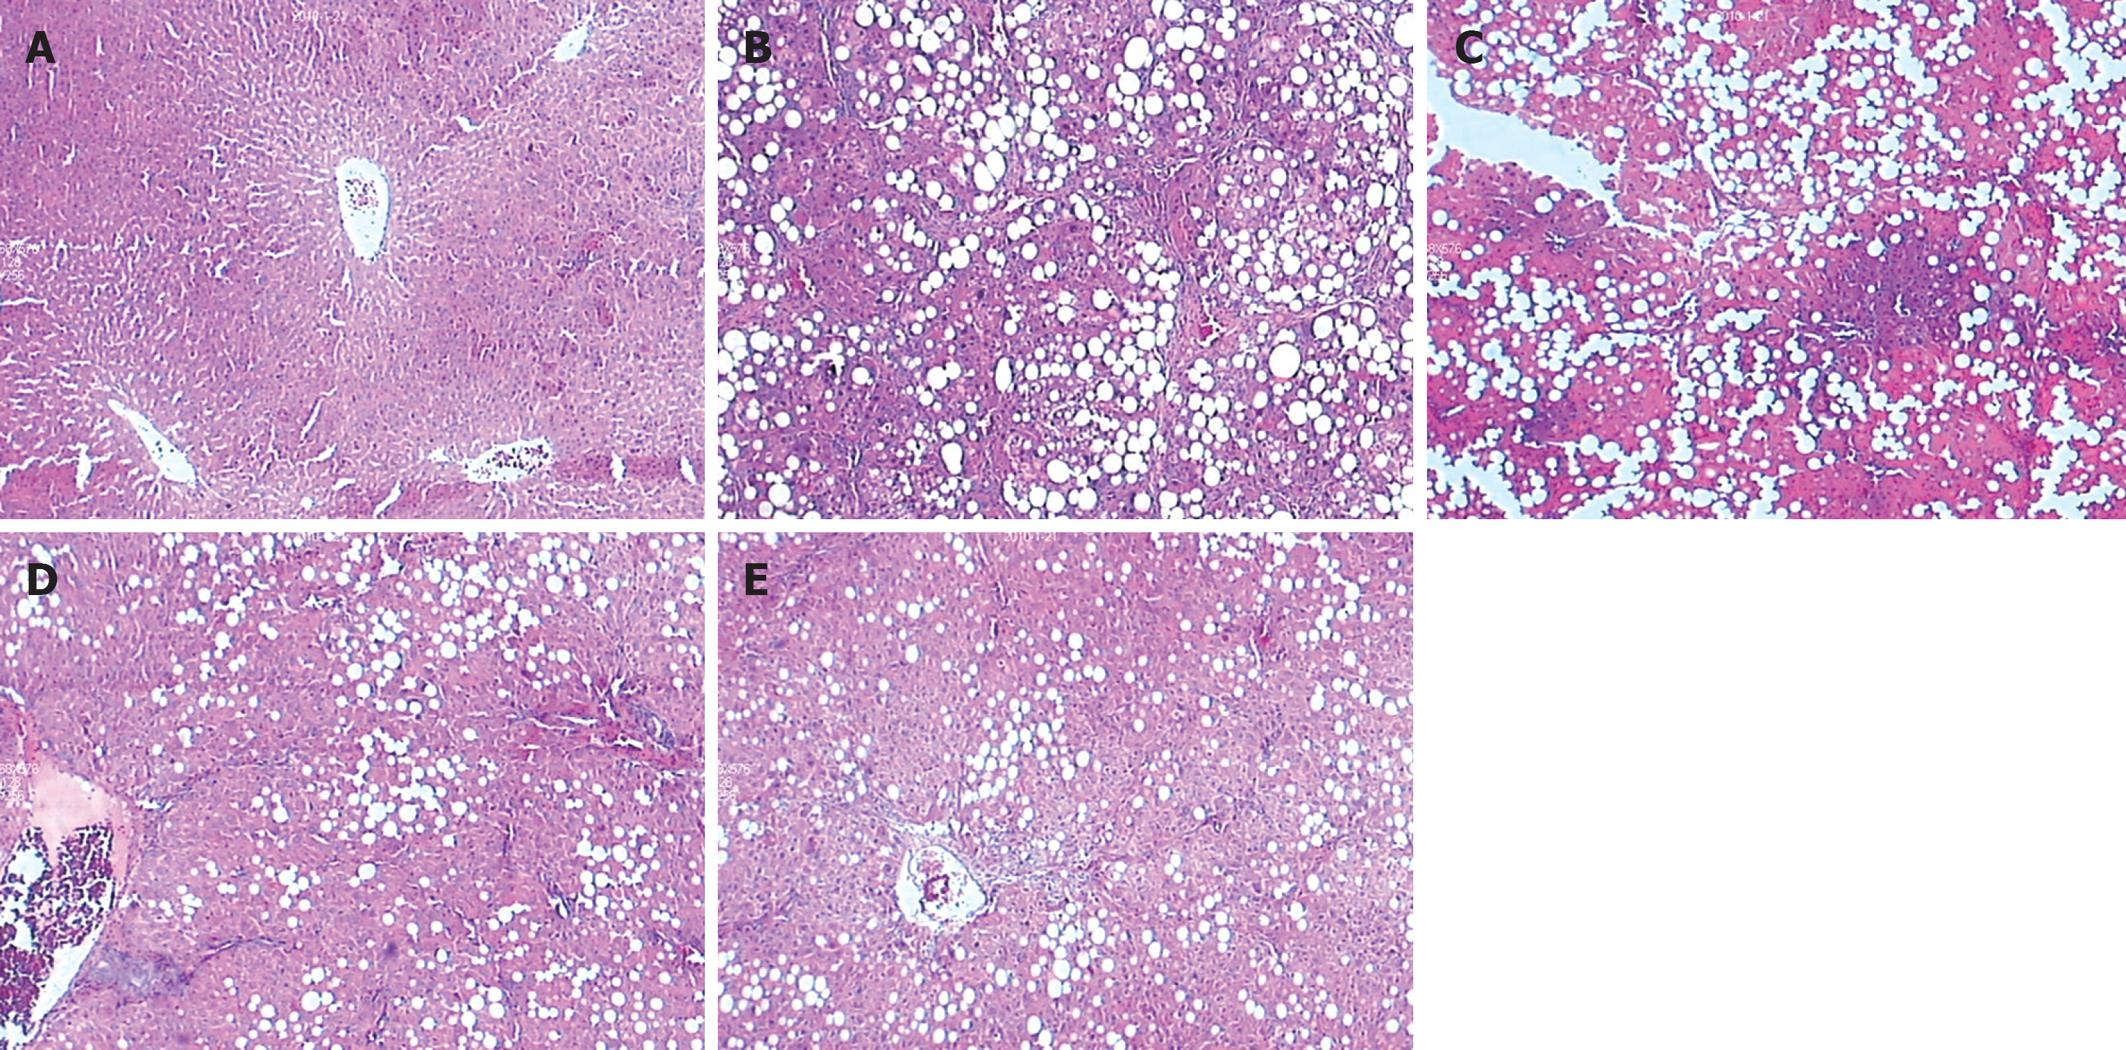
Figure 1 Liver tissue in each group of rats (HE staining, × 40 magnification).
A: Light microscopy showing normal liver tissue in the control group; B: Marked fibrosis in the model group; C-E: Pathological change in the treatment group was milder compared with that in the model group.
-
Citation: Wang YP, Cheng ML, Zhang BF, Mu M, Wu J. Effects of blueberry on hepatic fibrosis and transcription factor
Nrf2 in rats. World J Gastroenterol 2010; 16(21): 2657-2663 - URL: https://www.wjgnet.com/1007-9327/full/v16/i21/2657.htm
- DOI: https://dx.doi.org/10.3748/wjg.v16.i21.2657


