Copyright
©2010 Baishideng.
World J Gastroenterol. Jun 7, 2010; 16(21): 2579-2588
Published online Jun 7, 2010. doi: 10.3748/wjg.v16.i21.2579
Published online Jun 7, 2010. doi: 10.3748/wjg.v16.i21.2579
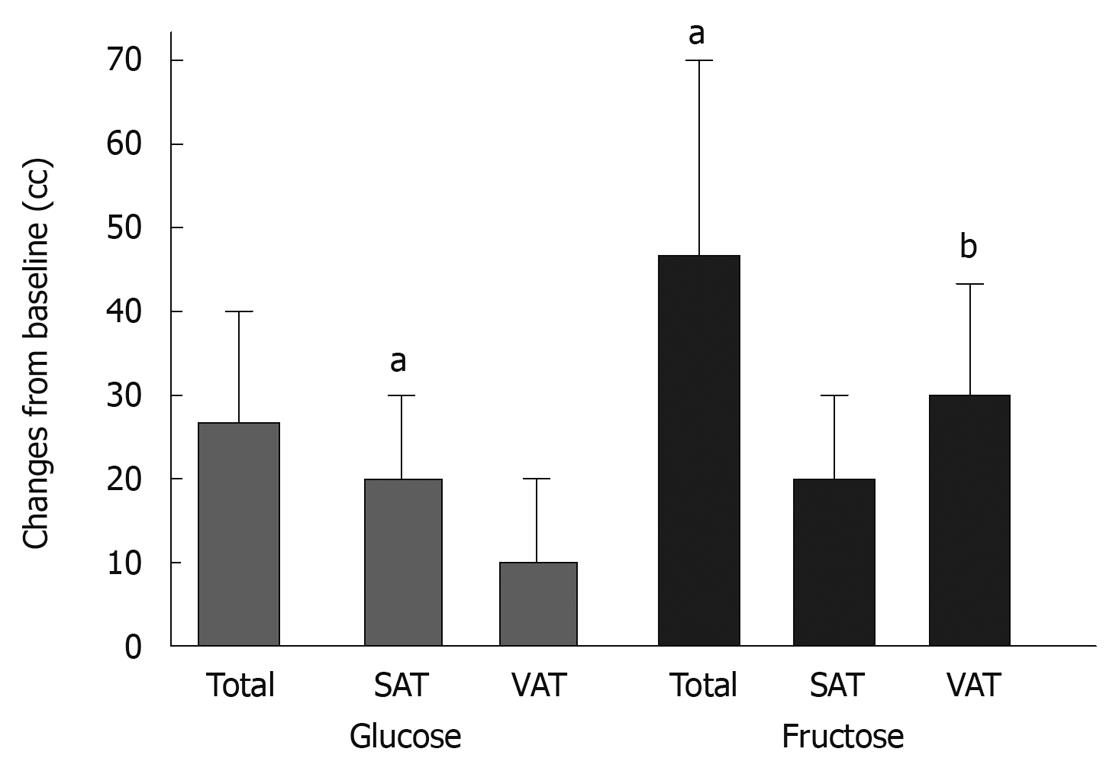
Figure 4 Changes in total abdominal adipose tissue, superficial adipose tissues (SAT), and visceral adipose tissue (VAT) volume after consuming glucose- or fructose-sweetened beverages for 10 wk.
aP < 0.05, bP < 0.01, 10 wk vs 0 wk; paired Student’s t test. Glucose, n = 14; Fructose, n = 17. Data represent mean ± SE (Stanhope, J Clin Invest, 2009).
- Citation: Nseir W, Nassar F, Assy N. Soft drinks consumption and nonalcoholic fatty liver disease. World J Gastroenterol 2010; 16(21): 2579-2588
- URL: https://www.wjgnet.com/1007-9327/full/v16/i21/2579.htm
- DOI: https://dx.doi.org/10.3748/wjg.v16.i21.2579


