Copyright
©2010 Baishideng.
World J Gastroenterol. Jan 14, 2010; 16(2): 156-166
Published online Jan 14, 2010. doi: 10.3748/wjg.v16.i2.156
Published online Jan 14, 2010. doi: 10.3748/wjg.v16.i2.156
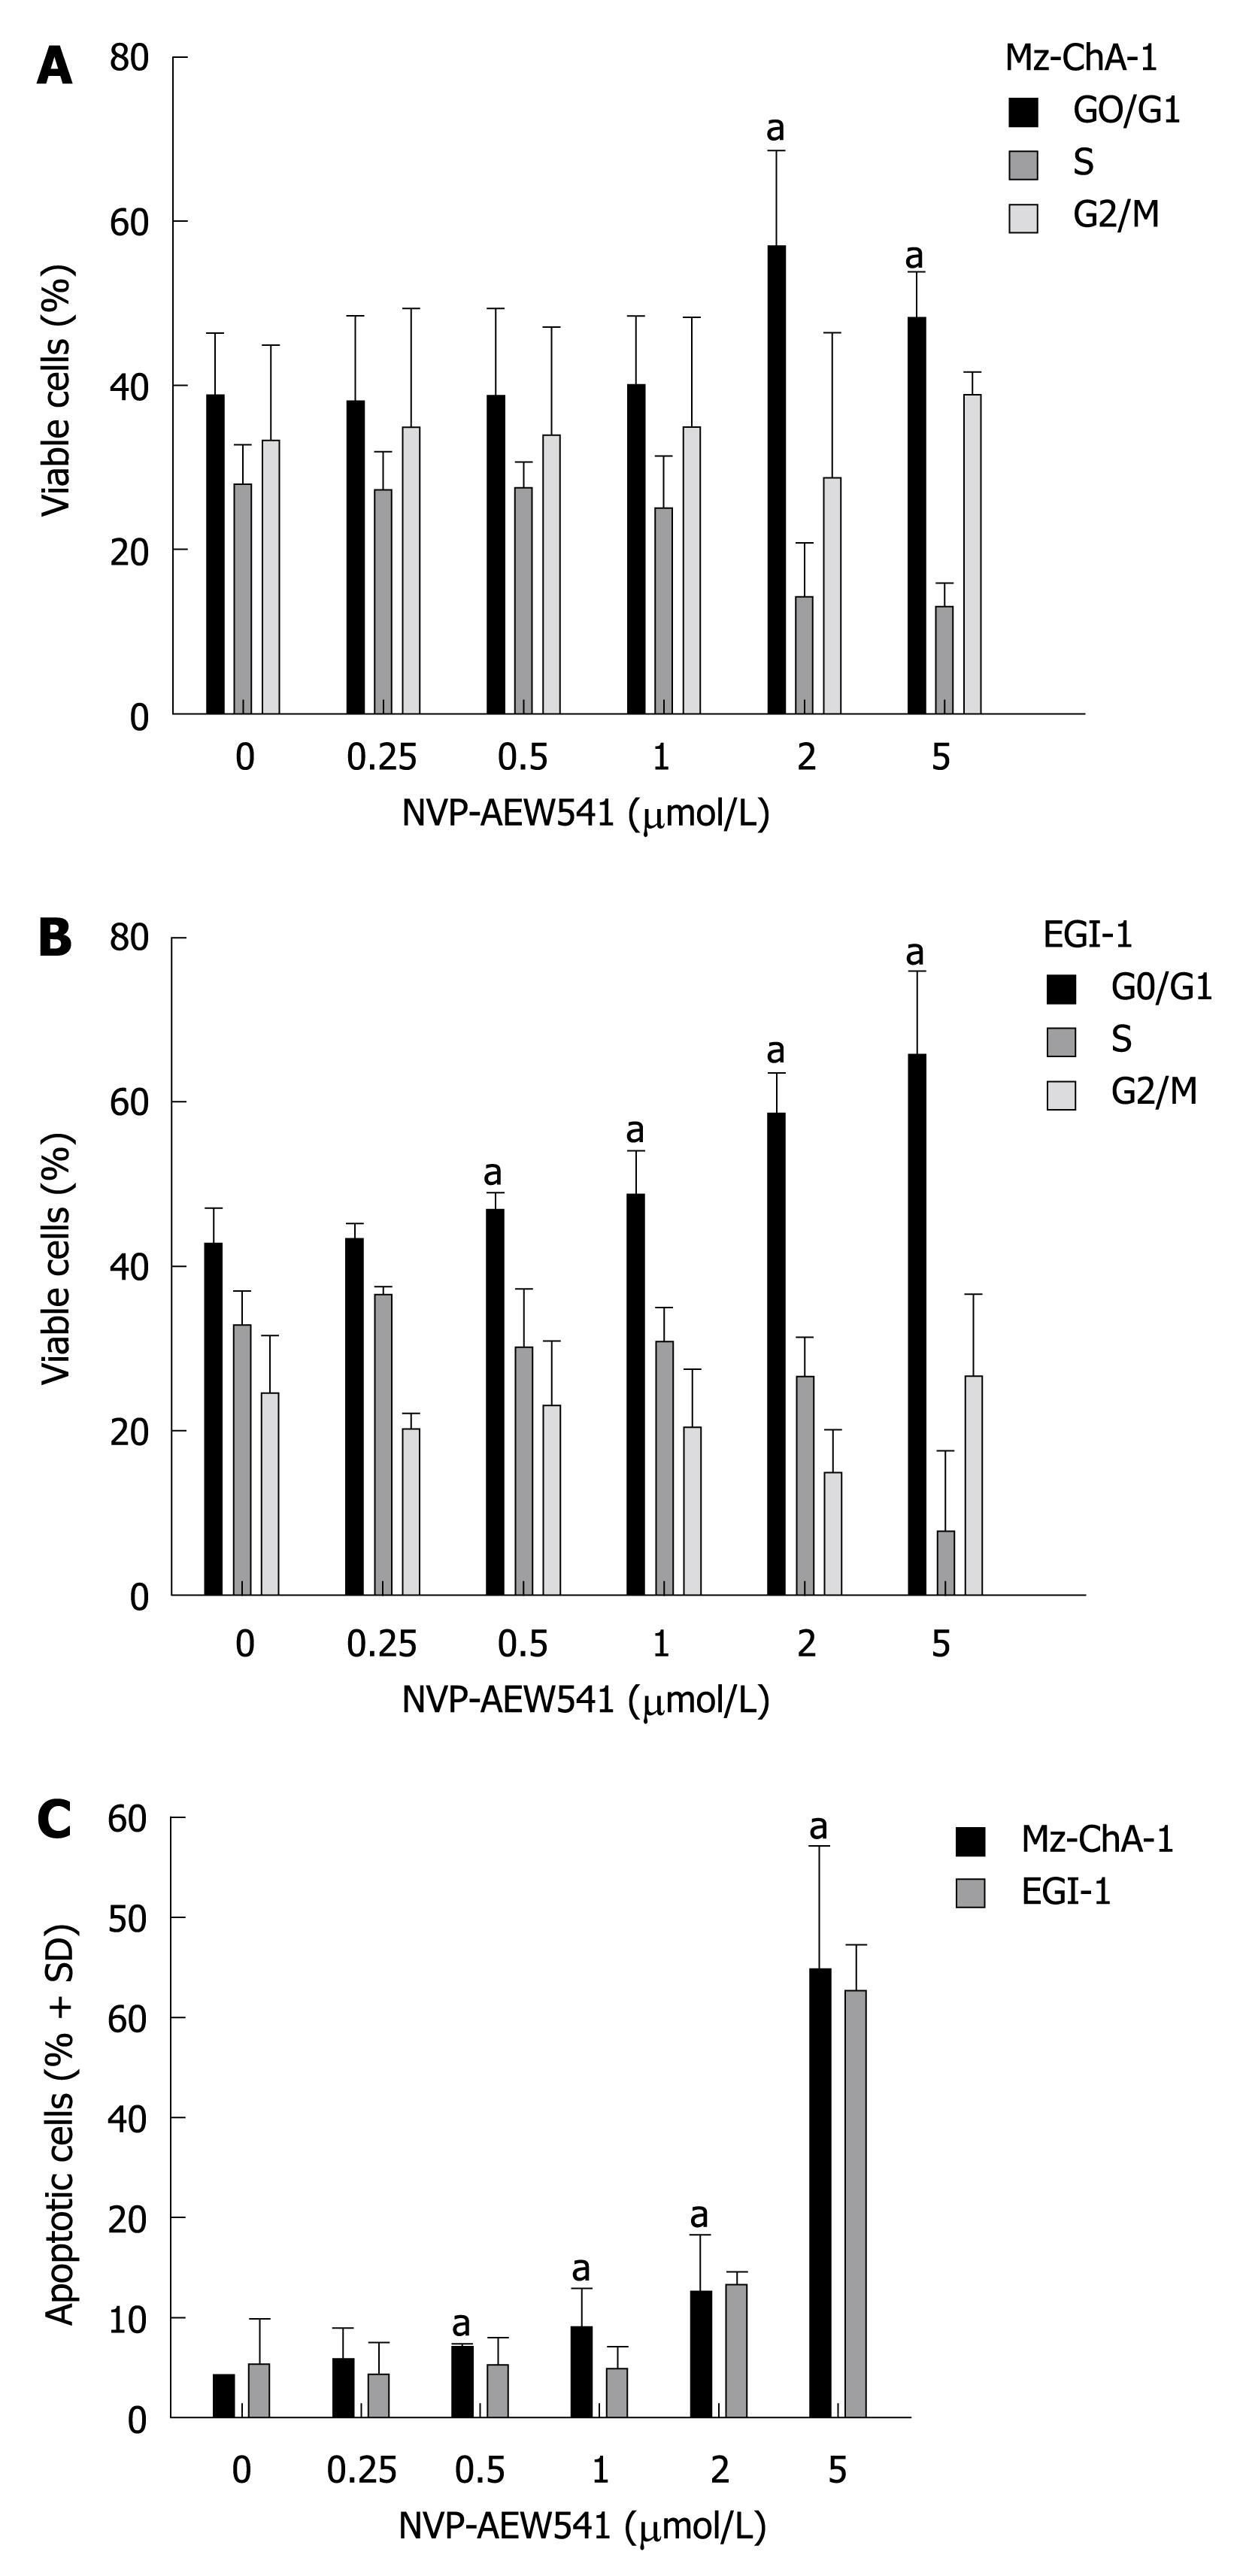
Figure 3 Cell cycle analysis.
A: In vitro treatment of selected cell line EGI-1 with NVP-AEW541 for 36 h (n = 3); B: In vitro treatment of selected cell line Mz-ChA-1 (n = 3). Cells were stained with propidium iodide and analyzed by flow cytometry. ModFitLT 2.0 software was used to determine cell cycle proportions according to cellular DNA content; doublets were excluded by gating for width of fluorescence signal (FL2-W) (aP < 0.05 for G0/G1 fraction, treated cells vs control); C: Cells having less than single DNA content (sub-G1 fraction) were presumed to be apoptotic (n = 3) (aP < 0.05, treated cells vs control; error bars represent SD).
- Citation: Wolf S, Lorenz J, Mössner J, Wiedmann M. Treatment of biliary tract cancer with NVP-AEW541: Mechanisms of action and resistance. World J Gastroenterol 2010; 16(2): 156-166
- URL: https://www.wjgnet.com/1007-9327/full/v16/i2/156.htm
- DOI: https://dx.doi.org/10.3748/wjg.v16.i2.156


