Copyright
©2010 Baishideng.
World J Gastroenterol. May 21, 2010; 16(19): 2378-2387
Published online May 21, 2010. doi: 10.3748/wjg.v16.i19.2378
Published online May 21, 2010. doi: 10.3748/wjg.v16.i19.2378
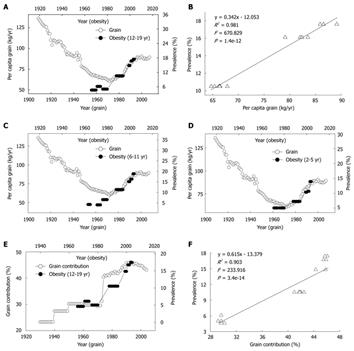
Figure 4 Correlations between consumption and contribution of grain and prevalence of obesity in US children.
A: Trends in US per capita grain consumption in 1909-2007 (Ref. 31) and in the obesity prevalence in the children aged 12-19 years in 1966-2004 (Ref. 28); B: The linear regression plot of the obesity prevalence in 1988-2004 against grain consumption in 1978-1994 using the data in A; C and D: Relationships between the grain consumption (Ref. 31) and the prevalence of obesity in the children aged 6-11 and 2-5 years (Ref. 28). R2 = 0.902 (P = 7.1e-7) and 0.955 (P = 9.7e-9), for 2-5 years age group and 6-11 years age group; E: Trends in the grain contribution to niacin (Ref. 8 and Ref. 9) and in the obesity prevalence in the children aged 12-19 years (Ref. 28); F: The linear regression plot of the prevalence of obesity in 1966-2004 against grain contribution in 1956-1994 using the data in E.
- Citation: Li D, Sun WP, Zhou YM, Liu QG, Zhou SS, Luo N, Bian FN, Zhao ZG, Guo M. Chronic niacin overload may be involved in the increased prevalence of obesity in US children. World J Gastroenterol 2010; 16(19): 2378-2387
- URL: https://www.wjgnet.com/1007-9327/full/v16/i19/2378.htm
- DOI: https://dx.doi.org/10.3748/wjg.v16.i19.2378


