Copyright
©2010 Baishideng.
World J Gastroenterol. May 21, 2010; 16(19): 2378-2387
Published online May 21, 2010. doi: 10.3748/wjg.v16.i19.2378
Published online May 21, 2010. doi: 10.3748/wjg.v16.i19.2378
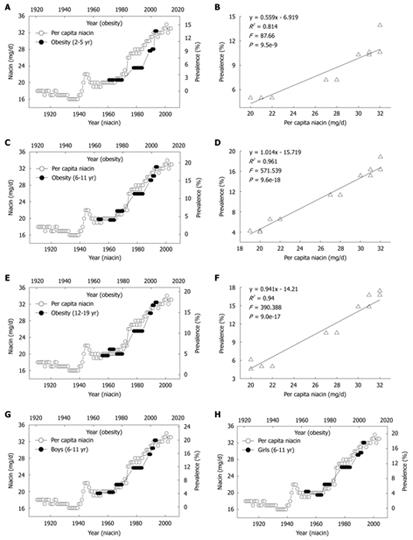
Figure 3 Correlations between US per capita niacin consumption and obesity prevalence in US children.
A, C and E: The trends in the daily per capita niacin consumption in 1909-2004 (Ref. 5) and in the obesity prevalence in the children aged 2-5, 6-11 and 12-19 years (Ref. 28); B, D and F: The 10-year lag-regression plots of the obesity prevalence in different age groups against daily per capita niacin consumption using the data in A, C, and E; G and H: The obesity prevalence in the age group of 6-11 years of either sex in 1963-2004 (Ref. 29 and 30) increased in parallel with the per capita niacin consumption in 1953-1994.
- Citation: Li D, Sun WP, Zhou YM, Liu QG, Zhou SS, Luo N, Bian FN, Zhao ZG, Guo M. Chronic niacin overload may be involved in the increased prevalence of obesity in US children. World J Gastroenterol 2010; 16(19): 2378-2387
- URL: https://www.wjgnet.com/1007-9327/full/v16/i19/2378.htm
- DOI: https://dx.doi.org/10.3748/wjg.v16.i19.2378


