INTRODUCTION
The high prevalence of obesity, a major risk factor for type 2 diabetes, has been recognized as a serious global health problem[1]. It is likely that both dietary factors and physical inactivity may contribute to the development of obesity[2,3]. However, the reason why the prevalence of obesity suddenly increased dramatically starting around 1980 in the US is not well understood[4]. It is argued that eating and dietary quality factors may act as a primary driver for the obesity epidemic[2,4]. Therefore, exploring dietary risk factors should be of importance for the prevention and treatment of obesity and type 2 diabetes.
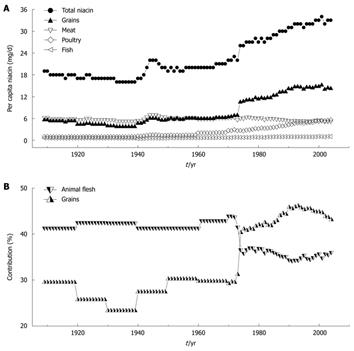
During the past few decades, one of the significant, but relatively overlooked worldwide changes in dietary composition has been the marked increase in the content of niacin (nicotinamide and nicotinic acid). For example, as shown in Figure 1A, the daily US per capita niacin consumption has maintained an increasing trend since the early 1940s, and has reached 33 mg in the early 2000s[5], which is more than two times the recommended dietary allowance (RDA) by the US Food and Nutrition Board (RDA: 14 and 16 mg/d for adult women and men, respectively)[6]. Animal flesh (meat, poultry and fish) and grains are the largest contributors of dietary niacin. Most of the increased niacin consumption comes from grain products due to the implementation of mandatory niacin-fortification (i.e. the addition of niacin to food) started from the early 1940s[7]. Most significantly, a sharp increase in the grain contribution in 1974 due to an update of niacin-fortification standards has made grains the largest contributor (Figure 1B)[8,9]. However, the effect of long-term exposure to excess niacin on human health is poorly understood.
Figure 1 Trends in per capita niacin consumption and contributions of grains and animal flesh to niacin in the US.
A: The trends in total niacin consumed per capita per day in 1909-2004 and in the amounts from grains and animal flesh (meat, poultry and fish); B: Changes in the percentage of grain and animal flesh contribution to dietary niacin. The data on niacin consumption are derived from Ref. 5. The data on the grain and animal flesh contribution to niacin are derived from Ref. 8 (1909-2000) and Ref. 9 (2001-2004). The per capita niacin consumption (A) and the grain contribution to niacin (B) have been suddenly increased since 1974 due to an update in niacin-fortification standards.
Niacin-fortification has been practiced first in many developed countries to prevent pellagra, a disease due to niacin deficiency[10], and then introduced to developing countries[11]. Soon after the introduction of niacin-fortification, the prevalence of obesity and diabetes has begun to increase rapidly first in developed countries and then in developing countries[12,13], basically in a similar way as the niacin-fortification spread. Thus, there is the possibility that niacin-fortification-induced increase in dietary niacin may be involved in the increased global prevalence of obesity and diabetes. However, there are very limited data regarding the possible adverse long-term consequences of niacin-fortification.
Grains (flour and cereals), the main source of carbohydrate, are the most widely used vehicles for niacin-fortification[11]. As a result, the niacin content in the fortified grain products has been significantly increased. Traditionally, low-fat, high-carbohydrate diets were used to treat type 2 diabetes[14,15]. However, since the implementation of niacin-fortification in the US from the early 1940s and the significant increase in carbohydrate consumption during the past three decades, more and more studies from the US have found that high-carbohydrate diets increase, instead of decrease, the risk for obesity and type 2 diabetes[12,16,17]. Then, low-carbohydrate diets have been used to treat obesity and diabetes since the late 1990s[18-20]. Whether such a profound change in the effect of carbohydrate diets is related to niacin fortification of grains is not known.
Obesity is characterized by increased appetite and insulin resistance[21,22], whereas niacin is a potent stimulator of appetite and niacin deficiency may lead to appetite loss[10]. Moreover, large doses of niacin have long been known to impair glucose tolerance[23,24], induce insulin resistance and enhance insulin release[25,26]. Evidence suggests that niacin-induced increase in insulin release may be a compensation of pancreatic islet β cells in response to the insulin resistance[25,26]. However, whether excess niacin intake is involved in the increased appetite and the insulin resistance of obesity is unclear. Our recent study found that oxidative stress may mediate excess nicotinamide-induced insulin resistance, and that type 2 diabetic subjects have a slow detoxification of nicotinamide. These observations suggested that type 2 diabetes may be the outcome of the association of high niacin intake and the relative low detoxification of niacin of the body[27]. Based on these lines of evidence, we postulated that excess niacin intake may also play a role in obesity. To address this issue, this study explored the mechanism underlying niacin’s action on glucose metabolism, and the association between the US per capita niacin consumption and the obesity prevalence in the US.
MATERIALS AND METHODS
Nicotinamide load test
The present study was approved by the relevant ethics committee, and all the participants gave informed consent. Five healthy young male volunteers aged 20-24 years participated in the two oral glucose tolerance tests (glucose dose 75 g) with (NM-OGTT) or without (C-OGTT) oral co-administration of 300 mg nicotinamide (Lisheng Pharma, Tianjin, China), respectively, with an interval of 4 d. Each test was conducted after an overnight fast, venous blood (1.8 mL) was collected into sodium citrate tubes before, and 1, 2, 3, and 4 h after the administration. The blood samples were separated by centrifugation (1500 ×g, 10 min). Aliquots of each plasma sample were placed directly in liquid nitrogen and then transferred to -80°C for later analysis.
Assays of blood glucose, plasma insulin and hydrogen peroxide
Blood glucose was measured using a glucometer (OneTouch Ultra, LifeScan Inc.). Plasma insulin was measured by radioimmunoassay using commercial kits (Beijing North Institute of Biological Technology, China). Plasma hydrogen peroxide (H2O2) concentration was measured using an H2O2 Assay Kit (Beyotime Biotechnology, Jiangsu, China).
Determination of nicotinamide and N1-methylnicotinamide
Nicotinamide and N1-methylnicotinamide were analyzed, as previously described[27], using a high-performance liquid chromatography (HPLC) system that consisted of an LC-9A pump (Shimadzu, Kyoto, Japan), a Rheodyne 7725i sample injector with a 20-μL sample loop (Rheodyne LLC, Rohnert Park, CA, USA), a Hypersil ODS C18 column (Thermo, Bellefonte, PA, USA) and a Waters 470 fluorescence detector (Milford, MA, USA).
Data sources
The data used for assessing the relationship between niacin consumption and obesity prevalence were derived from the databases of the US Centers for Disease Control and Prevention (CDC) and of the Economic Research Service of the US Department of Agriculture. The data on the prevalence of obesity (body mass index ≥ 95th percentile for age and sex) in US children and adolescents were from National Health Examination Survey (NHES) 2 (1963-1965, only available for the age group of 6-11 years), NHES 3 (1966-1970, only available for the age group of 12-19 years), the National Health and Nutrition Examination Surveys (NHANES) I (1971-1974), II (1976-1980), III (1988-1994), and the continuous NHANES data collection (1999-2000, 2001-2002, 2003-2004)[28-30]. NHES and NHANES are conducted by the CDC, and include a series of cross-sectional nationally representative health examination surveys. Each cross-sectional survey provides a national estimate for the US population at the time of the survey. Detailed descriptions of the survey methods are available elsewhere[29,30], and on-line (http://www.cdc.gov/nchs/nhanes.htm). The nutrient data on the US per capita niacin consumption in 1909-2004[5], grain consumption in 1909-2007[31], grain contribution to niacin in 1909-2000[8] and in 2001-2004[9] and ready-to-eat cereal (RTE) consumption[32] were derived from the databases of the Economic Research Service (ERS) of the US Department of Agriculture. ERS annually calculates the amounts of several hundred foods available for human consumption in the US and provides estimates of per capita availability. The estimates of nutrients in the food supply reflect Federal enrichment and fortification standards and technological advances in the food industry[8].
Statistical analysis
The data are presented as mean ± SD. Statistical differences in the data were evaluated by paired Student’s t test. Lag-regression analysis was used to test the relationships between the consumption of niacin or grain and the obesity prevalence in the US children and adolescents using SPSS software (SPSS Inc., Chicago, USA). Statistical significance was set at P < 0.05.
RESULTS
Dynamic effect of nicotinamide on blood glucose metabolism
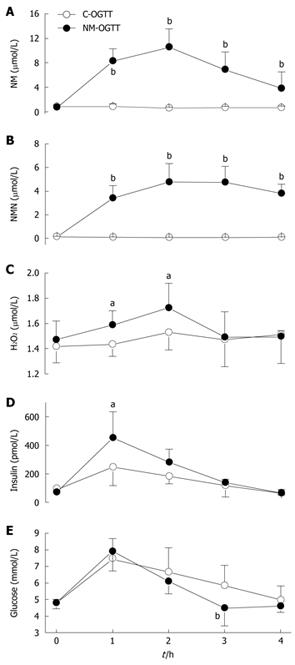
The methylation of nicotinamide to N1-methylnicotinamide is a major mechanism to eliminate excess nicotinamide[27]. As shown in Figure 2, in C-OGTT, the plasma concentrations of nicotinamide and N1-methylnicotinamide were fairly constant (Figure 2A and B), and the 2-h plasma level of H2O2, a major reactive oxygen species (ROS), was slightly increased, but without statistical significance compared with the value before C-OGTT (Figure 2C). In contrast, NM-OGTT led to a significant increase in plasma nicotinamide and N1-methylnicotinamide levels, with a peak at approximate 2 h (Figure 2A and B). In parallel with the rising phase of plasma nicotinamide and N1-methylnicotinamide, there was a significant increase in 1-h and 2-h plasma H2O2 levels in NM-OGTT (Figure 2C). Importantly, although the 1-h and 2-h blood glucose values were similar in the two tests (Figure 2E), however, the 1-h plasma insulin level was much higher in NM-OGTT than in C-OGTT (Figure 2D). As the plasma H2O2 returned to the basal level at 3 h in NM-OGTT (Figure 2C), there was a sharp decrease in the blood glucose concentration (Figure 2E). Two of the five subjects in NM-OGTT had reactive hypoglycemia symptoms (i.e. sweating, dizziness, faintness, palpitation and intense hunger) with the blood glucose levels below 3.6 mmol/L. In contrast, no subjects had reactive hypoglycemic symptoms during C-OGTT. These results indicated that nicotinamide overload might induce a biphasic effect, i.e. insulin resistance followed by hypoglycemia.
Figure 2 Dynamic effect of nicotinamide on plasma H2O2 level and glucose metabolism.
A-E: Dynamic changes in the concentrations of plasma nicotinamide (NM), N1-methylnicotinamide (NMN), H2O2, insulin and blood glucose in C-OGTT and NM-OGTT (co-administration of 300 mg nicotinamide and 75 g glucose). For each point, n = 5. Values represent mean ± SD, aP < 0.05, bP < 0.01 vs C-OGTT.
Association between niacin consumption and obesity prevalence in US children
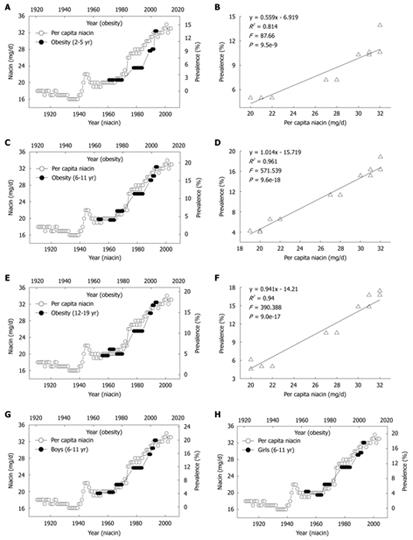
We next investigated the relationship between the daily per capita niacin consumption and the obesity prevalence in US children and adolescents. There were two historical events in niacin-fortification in the US. The first is the initial introduction of niacin-fortification in the early 1940s and the second is the update of fortification standards in 1974. These two events resulted in significant increases in the per capita niacin consumption respectively in the 1940s and in the mid-1970s. Evidently, the prevalence of obesity in US children of all age groups increased in parallel with the increase in the per capita niacin consumption with a 10-year lag (Figure 3A, C and E). Lag-regression analysis revealed that the obesity prevalence in the children of all age groups was determined by niacin consumption (Figure 3B, D and F). This relationship was observed in both sexes (Figure 3G and H) (R2 = 0.958 and 0.96 for boys and girls aged 6-11 years, P = 2.6e-17 and 1.6e-17, respectively; R2 = 0.949 and 0.92 for boys and girls aged 12-19 years, P = 1.2e-17 and 3.4e-15, respectively).
Figure 3 Correlations between US per capita niacin consumption and obesity prevalence in US children.
A, C and E: The trends in the daily per capita niacin consumption in 1909-2004 (Ref. 5) and in the obesity prevalence in the children aged 2-5, 6-11 and 12-19 years (Ref. 28); B, D and F: The 10-year lag-regression plots of the obesity prevalence in different age groups against daily per capita niacin consumption using the data in A, C, and E; G and H: The obesity prevalence in the age group of 6-11 years of either sex in 1963-2004 (Ref. 29 and 30) increased in parallel with the per capita niacin consumption in 1953-1994.
Association between grain consumption and obesity prevalence in US children
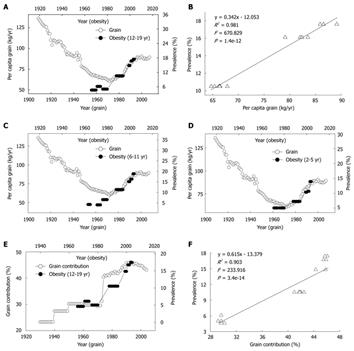
Grains have been used as a major vehicle for niacin-fortification. The increase in the daily per capita niacin consumption from grains reflects the fortification level and the trend toward the consumption of fortified grain products. Although the US per capita grain consumption steadily decreased from the late 1930s through the early 1970s (Figure 4A), the grain contribution to niacin actually significantly increased due to niacin-fortification (Figure 4E). In the early 20th century, high per capita consumption of non-fortified grains was associated with a low prevalence of obesity in US children and adolescents. However, the re-increase in the consumption of the grain products fortified with more niacin since 1974 was followed by a steep increase in the obesity prevalence in the US children of all age groups in the 1980s and 1990s. The lag was ten years (Figure 4A, C and D). Moreover, the obesity prevalence in US children also increased in parallel with the increase in grain contribution to niacin with a 10-year lag (Figure 4E). The regression analyses showed significant lag-correlations between the grain contribution to niacin and the obesity prevalence of US children aged 2-5 years (R2 = 0.726, P = 4.8e-7), 6-11 years (R2 = 0.898, P = 6.8e-13) and 12-19 years (Figure 4F).
Figure 4 Correlations between consumption and contribution of grain and prevalence of obesity in US children.
A: Trends in US per capita grain consumption in 1909-2007 (Ref. 31) and in the obesity prevalence in the children aged 12-19 years in 1966-2004 (Ref. 28); B: The linear regression plot of the obesity prevalence in 1988-2004 against grain consumption in 1978-1994 using the data in A; C and D: Relationships between the grain consumption (Ref. 31) and the prevalence of obesity in the children aged 6-11 and 2-5 years (Ref. 28). R2 = 0.902 (P = 7.1e-7) and 0.955 (P = 9.7e-9), for 2-5 years age group and 6-11 years age group; E: Trends in the grain contribution to niacin (Ref. 8 and Ref. 9) and in the obesity prevalence in the children aged 12-19 years (Ref. 28); F: The linear regression plot of the prevalence of obesity in 1966-2004 against grain contribution in 1956-1994 using the data in E.
Association between RTE consumption and the obesity prevalence in US children
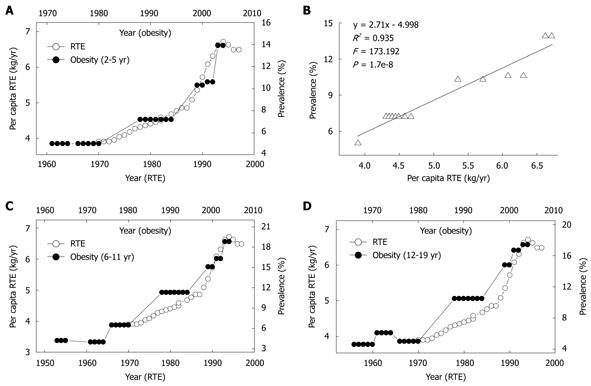
ERT, a popular food item for many Americans, especially children, is the most common vehicle for niacin-fortification in the US. The continued upward trend of niacin since the mid-1970s has been primarily due to the increase in the fortification standards of RTE in 1974 and the greater use of enriched grain products[8]. As shown in Figure 5, the yearly per capita consumption of RTE has rapidly increased since 1970, and the obesity prevalence in the US children of all age groups increased in parallel with the increase in the RTE consumption with a 10-year lag. There were significant correlations between the RTE consumption in 1970-1994 and the obesity prevalence in US children aged 2-5 years (Figure 5B), 6-11 years (R2 = 0.933, P = 2.1e-8) and 12-19 years (R2 = 0.913, P = 1.0e-7) in 1980-2004.
Figure 5 Relationship between per capita ready-to-eat cereal (RTE) consumption and prevalence of obesity in US children.
A: Trends in US per capita RTE consumption in 1970-1997 (Ref. 32) and in the prevalence of obesity in the 2-5 years age group; B: The linear regression plot of the obesity prevalence in 1980-2004 against RET consumption in 1970-1994 using the data in A; C and D: A similar relationship between the RTE consumption and the obesity prevalence in the 6-11 years and 12-19 years age groups.
DISCUSSION
The major findings of this study are: (1) nicotinamide overload may induce a biphasic effect on glucose metabolism, characterized by insulin resistance followed by hypoglycemia; and (2) there is a significant association between the US per capita niacin consumption and the obesity prevalence in US children and adolescents. These findings may help explain both the development of obesity and the increased prevalence of obesity.
Insulin resistance is a key feature of obesity[22]. Increasing evidence has indicated that systemic oxidative stress, characterized by elevation of plasma ROS, is an important trigger of insulin resistance[33]. In agreement with this suggestion, this study found that the plasma insulin level increased in parallel with the rise of plasma H2O2, the major mediator of oxidative stress, while decline in the H2O2 level led to hypoglycemia, which suggested that the insulin sensitivity increased. It seems that the oxidative stress plays a critical role in nicotinamide-induced insulin resistance. The present findings are in agreement with the hypothesis that niacin-induced increase in β-cell secretory capacity is the result of pancreatic islet adaptation to niacin-induced insulin resistance[25,26].
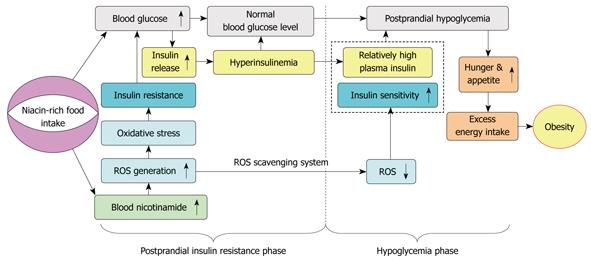
It is generally accepted that obesity results from excess energy intake and physical inactivity. A recent hypothesis suggests that factors favoring a trend toward hypoglycemia might induce excess energy intake and overweight[34]. Interestingly, the present study demonstrated that nicotinamide overload induced a biphasic response: insulin resistance in the early phase characterized by more insulin release due to the enhanced ROS production, and hypoglycemia in the late phase due to the different clearance rates of plasma ROS and insulin. The biphasic response may underlie the increased appetite in obesity: high nicotinamide diet may produce more ROS and decrease insulin sensitivity, which leads to more insulin release. Then, with the relative rapid fall of plasma ROS and the re-increase in insulin sensitivity, the relative high insulin level may lead to hypoglycemia, which may induce hunger, eating behavior change, and subsequent excess energy intake (Figure 6). As such, it is not difficult to imagine that long-term nicotinamide overload-induced insulin resistance may eventually lead to β-cell failure. From this point of view, it seems that long-term excess nicotinamide intake may be a primary cause of obesity and type 2 diabetes. Moreover, our previous study demonstrated that sweat is an effective way to eliminate excess nicotinamide from the body[27]. Thus, physical activity not only increases energy expenditure but also decreases insulin resistance by facilitating the elimination of excess nicotinamide through sweating, which may help explain why sweat-inducing activities are effective in preventing obesity and type 2 diabetes. It should be pointed that excess niacin-induced oxidative stress and abnormal glucose metabolism is expected to involve other blood glucose-controlling hormones, such as glucagon and glucagon-like peptides. Further studies are warranted to examine the effect of excess niacin intake on these hormones.
Figure 6 Proposed model of the role of niacin overload in obesity development.
Excess nicotinamide metabolism may induce a biphasic effect: postprandial hyperinsulinemia followed by postprandial hypoglycemia, in which reactive oxygen species (ROS) generation and scavenging may play a central role.
Since niacin overload may be involved in the development of obesity, determining whether there is niacin overload in the modern diet may be helpful for understanding the global prevalence of obesity. Generally, dietary niacin comes mainly from the following two main sources: niacin-rich foods and niacin fortified foods. In term of the development of obesity and diabetes, the known high-risk foods are those rich in niacin, such as meat[35,36]. Most importantly, niacin fortified-grain products have been the most significant source of niacin. As shown in Figure 1, the daily US per capita niacin consumption has been kept a rising trend since the implementation of mandatory niacin-fortification, and has been two times higher than the RDA in the early 2000s. The amount of the daily per capita niacin consumption from grains and animal flesh was 3.7 and 6.8 mg, respectively, before the introduction of mandatory niacin-fortification in the 1930s, and has increased to 14.8 and 11.8 mg, respectively, in 2000. The percentage of grain contribution to dietary niacin has been increased four times since the implementation of niacin fortification. It is obvious that niacin-fortification may be mainly responsible for niacin overload, and may play a role in the increased prevalence of obesity in the US. To test this hypothesis, we examined the relationship between US per capita niacin consumption and the prevalence of obesity in US children and adolescents. Indeed, the present results showed that the obesity prevalence in the US children of all age groups increased in parallel with the increase in the per capita niacin consumption and the increase in the grain contribution to niacin, with a 10-year lag. RTE is a popular food item for many Americans, especially children. The update of fortification standards in the US in 1974 has led to a significant increase in niacin content in RTE[8]. The present study also revealed that there was a significant lag-correlation between the obesity prevalence in US children and the RTE consumption. Since the late 1990s, the US per capita niacin consumption has remained relatively stable (around 32-33 mg/d per capita)[9]. According to the regression equations shown in Figure 3, the obesity prevalence in the US children of all age groups should have been near its peak now. Indeed, the most recent NHANES data showed that there was no significant change in obesity prevalence between 2003-2004 and 2005-2006 in US children[37].
Dietary factors play a key role in the development and prevalence of obesity and diabetes[12,16,35,36]. The increasing global prevalence of obesity and diabetes implies that there may be a common change in diet composition worldwide. It should be pointed out that one of the common and major global changes in diet composition in the last few decades is the significant increase in the content of dietary vitamins due to the spread of food fortification worldwide. The global prevalence of obesity and diabetes has spread in much the similar way as that of niacin-fortification, in contrast, those countries that had not introduced niacin-fortification or that prohibited niacin fortification before the early 1990s, such as Norway[38,39], have a low prevalence of obesity and diabetes in the 1990s, compared with the niacin-fortified countries such as the US and Canada. Thus, the possibility cannot be ruled out that the rapid global increase in the prevalence of obesity in the past three decades may be, at least in part, a man-made event due to niacin fortification.
Obesity is strongly associated with non-alcoholic fatty liver disease (NAFLD), a common disease characterized by an increase in intrahepatic triglyceride content with or without steatohepatitis[40]. As early as in 1964, Rikans et al[41] found that excess niacin in high fat diets can induce fatty liver in rats. Moreover, numerous case reports have shown that excess niacin can induce liver injury[6]. Thus, there is the possibility that excess niacin intake may play a role in the development of NAFLD. Investigating excess niacin metabolism and its toxic effects may be of help in gaining insight into the development of not only obesity but also NAFLD.
In summary, the present study demonstrates for the first time that nicotinamide overload-induced biphasic response in glucose metabolism may play a role in the development of obesity, and suggests that the high prevalence of obesity in US children and adolescents may involve a long-term niacin overload largely due to the grain fortification with niacin. It seems that the long-term safety of niacin fortification needs to be carefully evaluated.
COMMENTS
Background
Niacin, a potent stimulator of appetite, may induce insulin resistance at high doses. Global prevalence of obesity which is characterized by increased appetite and insulin resistance has occurred following the spread of grain fortification with niacin worldwide. However, how niacin stimulates appetite and whether excess dietary niacin plays a role in the obesity epidemic are not known.
Research frontiers
Obesity is directly related to diet and physical activity. Therefore, exploring the dietary risk factors for obesity and understanding the underlying mechanism of increased appetite and insulin resistance in obesity are important issues in the prevention and treatment of overweight and obesity.
Innovations and breakthroughs
The present study demonstrated for the first time that excess nicotinamide, when co-administered with glucose, induces biphasic response: insulin resistance in the early phase characterized by more insulin release due to the enhanced reactive oxygen species (ROS) production, and hypoglycemia in the late phase due to the different clearance rates of plasma ROS and insulin. The excess niacin-induced biphasic response may play a role in the development of obesity. This study also revealed for the first time that the obesity prevalence among US children and adolescents increased in parallel with the increase of the per capita niacin consumption with a 10-year lag, in which niacin fortification-induced sharp increase in niacin contents in grain products may play a major role. The present findings may help explain why there has been a sudden sharp increase in the obesity prevalence among US children and adolescents starting around the early 1980s, i.e. about 10 years after updating the niacin fortification standards in 1974.
Applications
Reducing niacin intake and facilitating niacin elimination through sweat-inducing physical activity may be a key factor in the prevention and treatment of obesity.
Peer review
Li et al studied in a small (pilot) study the effects of niacin overload on glucose metabolism in relation with a study performed in a large cohort, and this paper would be of interest.


