Copyright
©2010 Baishideng.
World J Gastroenterol. May 14, 2010; 16(18): 2291-2297
Published online May 14, 2010. doi: 10.3748/wjg.v16.i18.2291
Published online May 14, 2010. doi: 10.3748/wjg.v16.i18.2291
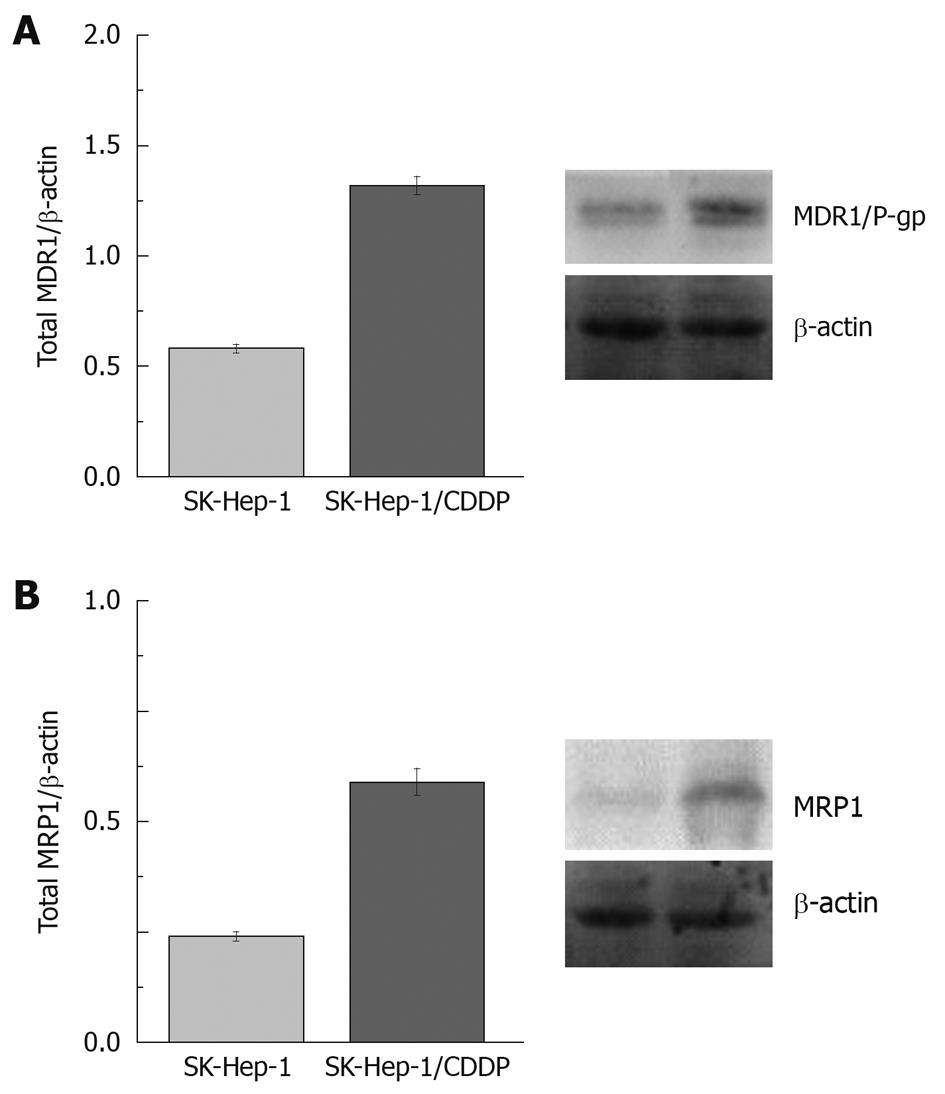
Figure 5 Representative Western blotting of total protein extracts from SK-Hep-1 and SK-Hep-1/CDDP cells.
A: Left: The relative level of MDR1/β-actin in each cell line in the bar graph (P < 0.05, n = 3). Right: Western blotting analysis of MDR1/P-gp; B: Left: The relative level of MRP1/β-actin in each cell line in the bar graph (P < 0.05, n = 3). Right: Expression level of total MRP1 protein in SK-Hep-1 and SK-Hep-1/CDDP cells. The data are representative of those obtained in 3 other experiments.
-
Citation: Zhou Y, Ling XL, Li SW, Li XQ, Yan B. Establishment of a human hepatoma multidrug resistant cell line
in vitro . World J Gastroenterol 2010; 16(18): 2291-2297 - URL: https://www.wjgnet.com/1007-9327/full/v16/i18/2291.htm
- DOI: https://dx.doi.org/10.3748/wjg.v16.i18.2291


