Copyright
©2010 Baishideng.
World J Gastroenterol. May 14, 2010; 16(18): 2252-2259
Published online May 14, 2010. doi: 10.3748/wjg.v16.i18.2252
Published online May 14, 2010. doi: 10.3748/wjg.v16.i18.2252
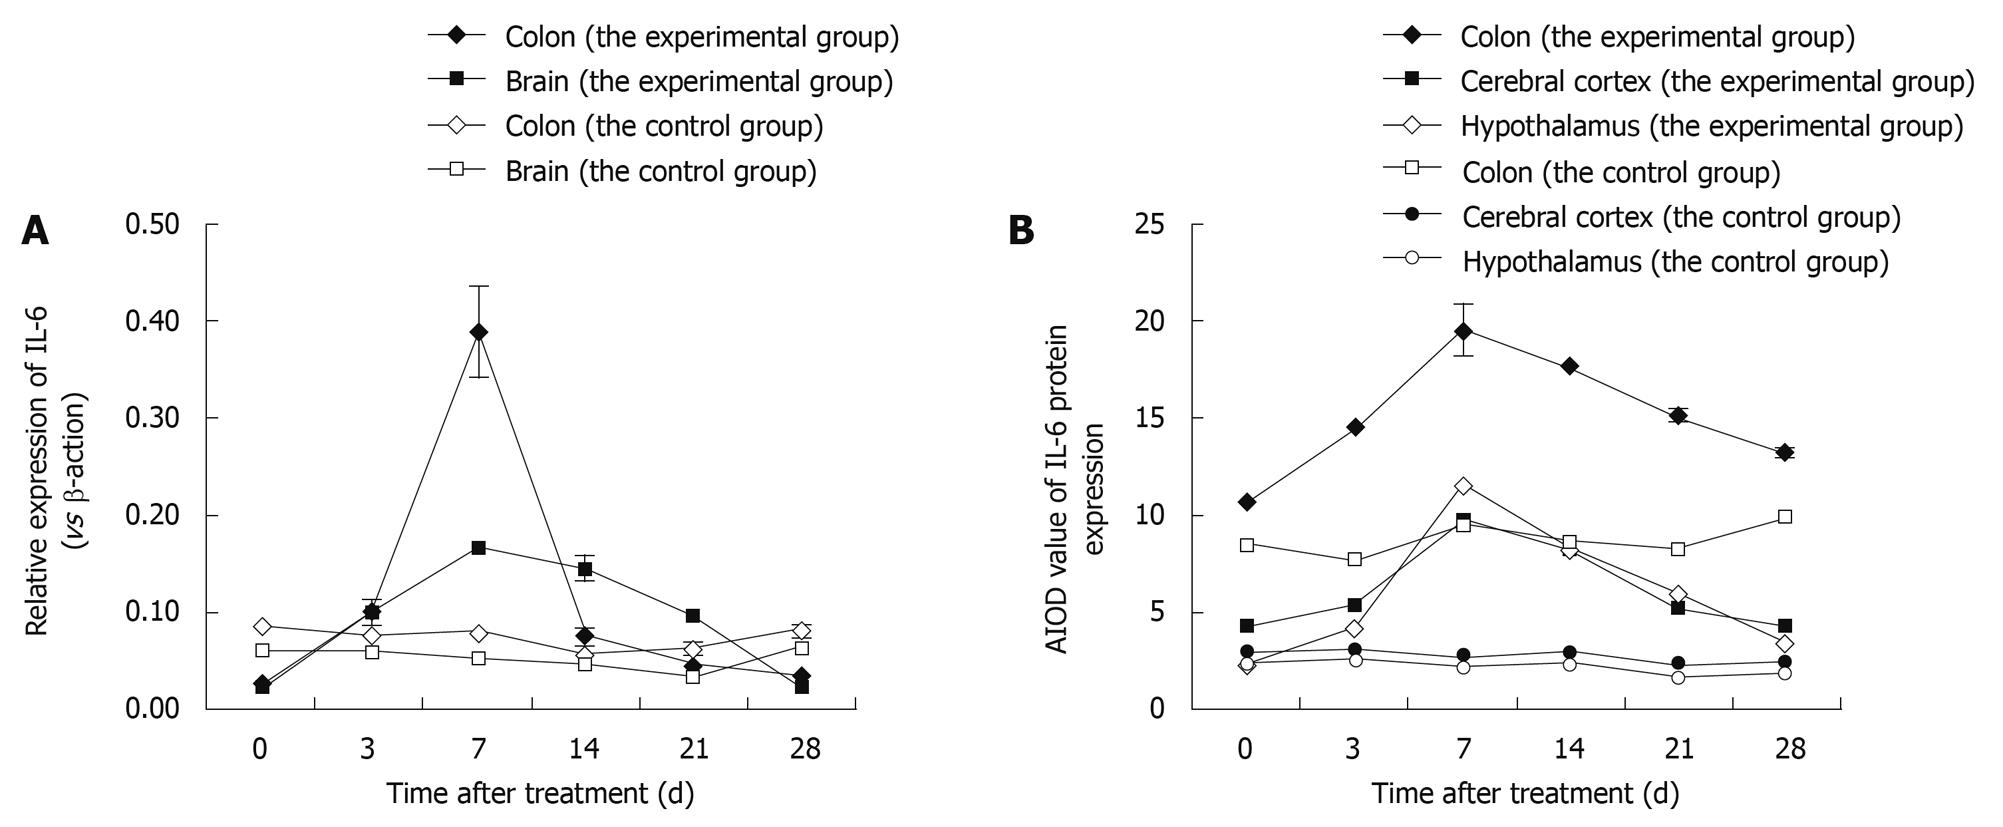
Figure 4 Variation in expression of interleukin-6 (IL-6) in the colon and brain of TNBS-induced colitis rats by time points (at days 3, 7, 14, 21 and 28) vs control rats.
A: The expression of IL-6 mRNA after real-time RT-PCR; Data shown as mean ± SD, n = 4-8; B: The average integrated optical density (AIOD) values for IL-6 protein expression after immunohistochemical staining. The results were determined by ANOVA.
- Citation: Wang K, Yuan CP, Wang W, Yang ZQ, Cui W, Mu LZ, Yue ZP, Yin XL, Hu ZM, Liu JX. Expression of interleukin 6 in brain and colon of rats with TNBS-induced colitis. World J Gastroenterol 2010; 16(18): 2252-2259
- URL: https://www.wjgnet.com/1007-9327/full/v16/i18/2252.htm
- DOI: https://dx.doi.org/10.3748/wjg.v16.i18.2252


