Copyright
©2010 Baishideng.
World J Gastroenterol. Apr 28, 2010; 16(16): 2046-2054
Published online Apr 28, 2010. doi: 10.3748/wjg.v16.i16.2046
Published online Apr 28, 2010. doi: 10.3748/wjg.v16.i16.2046
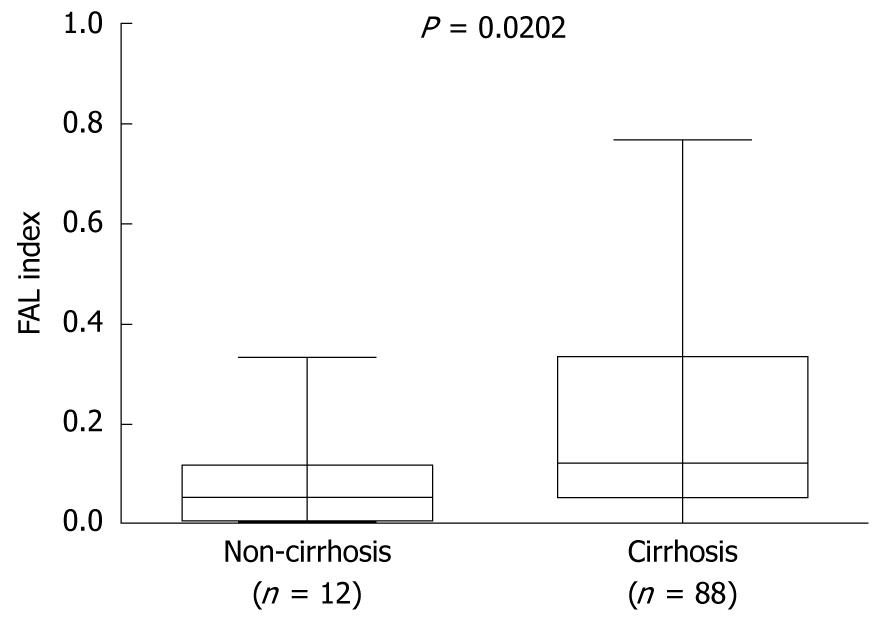
Figure 3 Correlation between FAL index (fractional allelic loss) and tumor size.
The box plot shows the median, quartile, and extreme values; the lines across the boxes indicate median FAL index.
- Citation: Huang GL, Li BK, Zhang MY, Zhang HZ, Wei RR, Yuan YF, Shi M, Chen XQ, Huang L, Li AH, Huang BJ, Li HH, Wang HY. LOH analysis of genes around D4S2964 identifies ARD1B as a prognostic predictor of hepatocellular carcinoma. World J Gastroenterol 2010; 16(16): 2046-2054
- URL: https://www.wjgnet.com/1007-9327/full/v16/i16/2046.htm
- DOI: https://dx.doi.org/10.3748/wjg.v16.i16.2046


