Copyright
©2010 Baishideng.
World J Gastroenterol. Apr 28, 2010; 16(16): 1993-1998
Published online Apr 28, 2010. doi: 10.3748/wjg.v16.i16.1993
Published online Apr 28, 2010. doi: 10.3748/wjg.v16.i16.1993
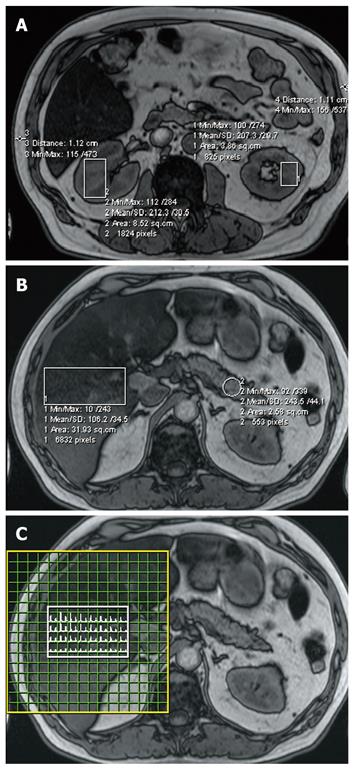
Figure 1 Regions of interest on magnetic resonance imaging (MRI) (OP series with 70º pulse angle and TE = 2.
4 ms) and the corresponding magnetic resonance spectroscopy (MRS). A: Kidney and subcutaneous tissue measurement; B: Liver and pancreas; C: Liver MRS spectral map, showing an array of water and fat peaks.
- Citation: Sijens PE, Edens MA, Bakker SJ, Stolk RP. MRI-determined fat content of human liver, pancreas and kidney. World J Gastroenterol 2010; 16(16): 1993-1998
- URL: https://www.wjgnet.com/1007-9327/full/v16/i16/1993.htm
- DOI: https://dx.doi.org/10.3748/wjg.v16.i16.1993


