Copyright
©2010 Baishideng.
World J Gastroenterol. Apr 21, 2010; 16(15): 1916-1923
Published online Apr 21, 2010. doi: 10.3748/wjg.v16.i15.1916
Published online Apr 21, 2010. doi: 10.3748/wjg.v16.i15.1916
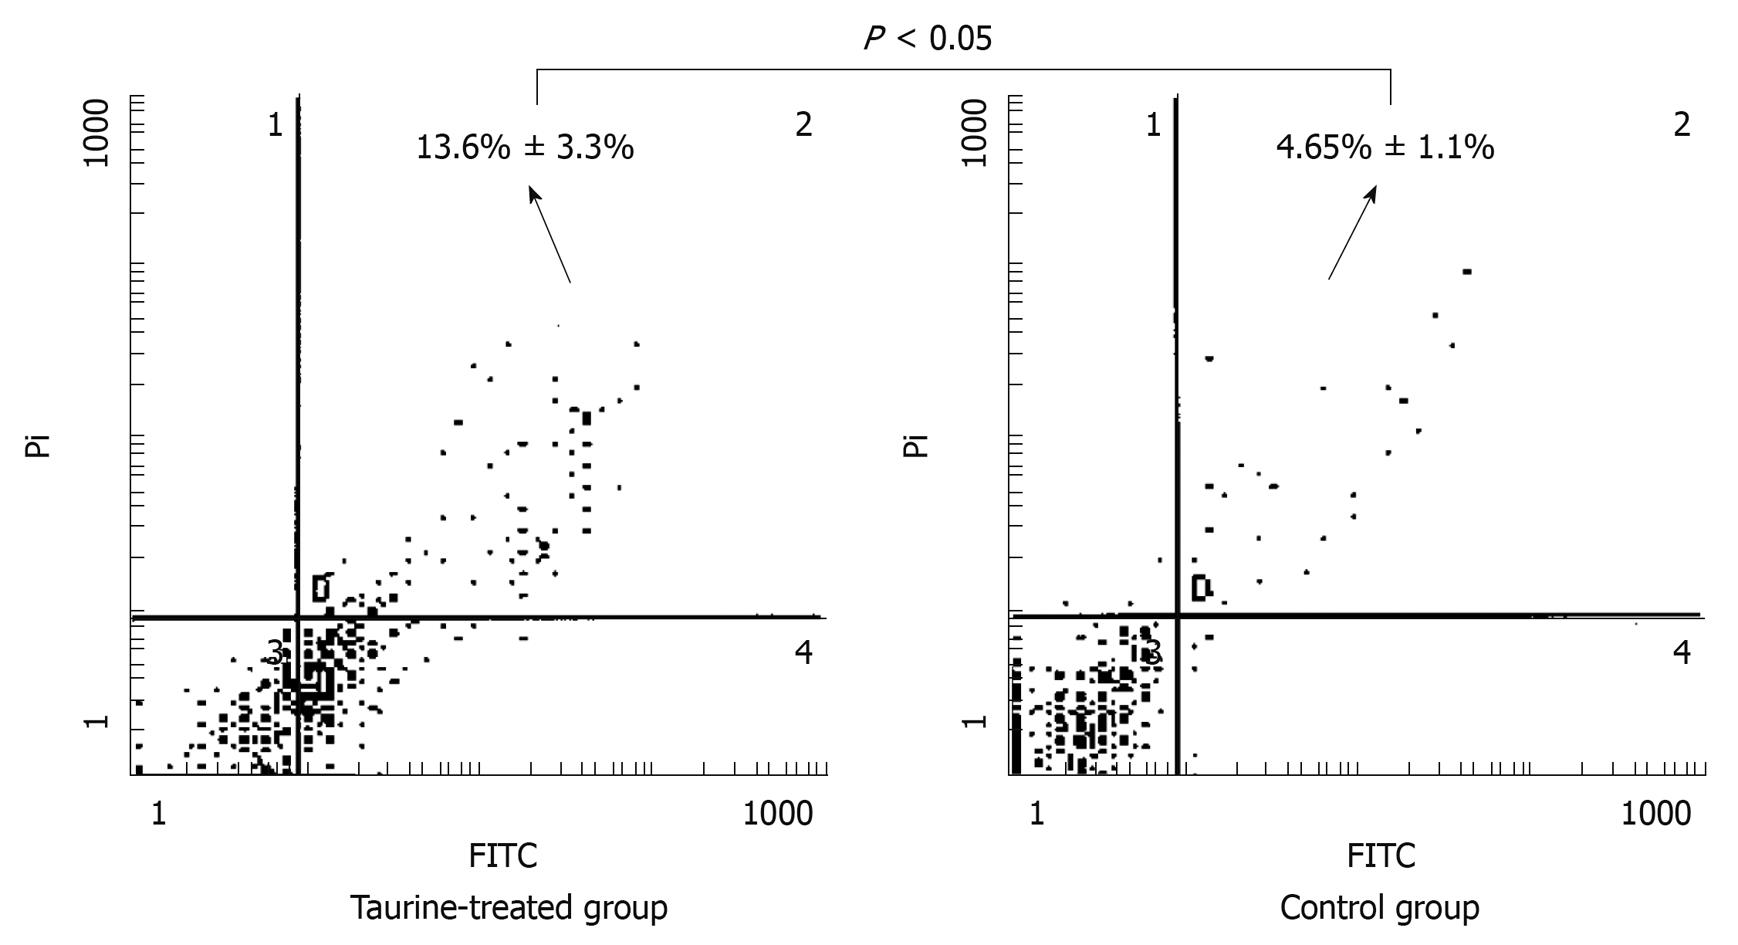
Figure 5 Apoptosis profiles of HSCs treated or untreated with taurine.
The experiment was repeated 3 times for each sample (t test, P < 0.05). Cell count in the second quadrant was used to calculate the apoptosis rate.
- Citation: Deng X, Liang J, Lin ZX, Wu FS, Zhang YP, Zhang ZW. Natural taurine promotes apoptosis of human hepatic stellate cells in proteomics analysis. World J Gastroenterol 2010; 16(15): 1916-1923
- URL: https://www.wjgnet.com/1007-9327/full/v16/i15/1916.htm
- DOI: https://dx.doi.org/10.3748/wjg.v16.i15.1916


