Copyright
©2010 Baishideng.
World J Gastroenterol. Apr 7, 2010; 16(13): 1598-1609
Published online Apr 7, 2010. doi: 10.3748/wjg.v16.i13.1598
Published online Apr 7, 2010. doi: 10.3748/wjg.v16.i13.1598
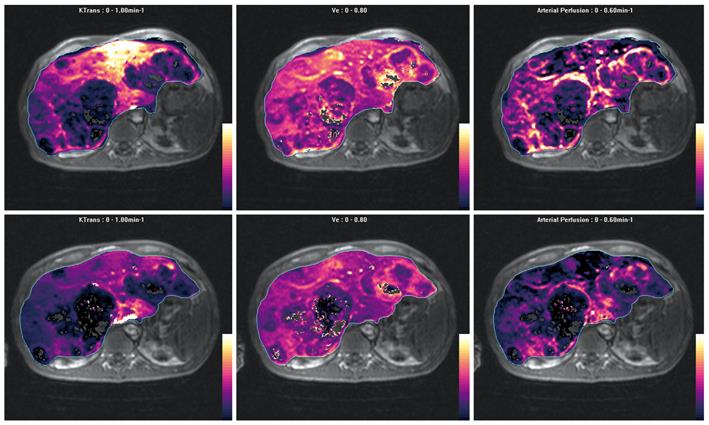
Figure 9 Parametric maps of efflux constant (Ktrans), extravascular extracellular space (Ve) and arterial perfusion fraction before (top row) and after (bottom row) anti-angiogenic therapy obtained using a dual-input, single-compartment, conventional compartment model (after Materne et al[46]).
Note multiple metastases in the liver, which are largely hypovascular but show increased arterial perfusion at the edge of the lesions. The metastases also show moderate Ve. After treatment with anti-angiogenic drug, arterial perfusion is reduced at the tumor rims, also with a decrease in tumor Ve. The Ktrans in the left lobe of the liver is also decreased, which may reflect drug effects on microscopic disease.
- Citation: Thng CH, Koh TS, Collins DJ, Koh DM. Perfusion magnetic resonance imaging of the liver. World J Gastroenterol 2010; 16(13): 1598-1609
- URL: https://www.wjgnet.com/1007-9327/full/v16/i13/1598.htm
- DOI: https://dx.doi.org/10.3748/wjg.v16.i13.1598


