Copyright
©2010 Baishideng.
World J Gastroenterol. Apr 7, 2010; 16(13): 1598-1609
Published online Apr 7, 2010. doi: 10.3748/wjg.v16.i13.1598
Published online Apr 7, 2010. doi: 10.3748/wjg.v16.i13.1598
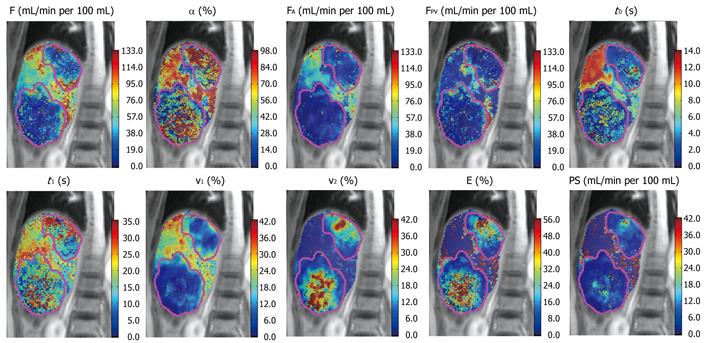
Figure 8 Parameteric maps of a patient with colorectal metastases derived from a dual-input, dual-compartment, DP tracer kinetic model.
F (blood flow), α (arterial fraction, or % hepatic arterial flow from total hepatic blood flow), FA (hepatic arterial blood flow), FPV (hepatic portal venous blood flow), t0 (contrast arrival time), t1 (MTT), v1 (fractional intravascular volume), v2 (fractional interstitial volume), E (extraction fraction), PS (permeability-surface area product). Note that in the two liver metastases demonstrated (outlined in pink), the lesions were characterized by lower total blood flow, but higher arterial fraction and fractional interstitial volume.
- Citation: Thng CH, Koh TS, Collins DJ, Koh DM. Perfusion magnetic resonance imaging of the liver. World J Gastroenterol 2010; 16(13): 1598-1609
- URL: https://www.wjgnet.com/1007-9327/full/v16/i13/1598.htm
- DOI: https://dx.doi.org/10.3748/wjg.v16.i13.1598


