Copyright
©2010 Baishideng.
World J Gastroenterol. Apr 7, 2010; 16(13): 1560-1566
Published online Apr 7, 2010. doi: 10.3748/wjg.v16.i13.1560
Published online Apr 7, 2010. doi: 10.3748/wjg.v16.i13.1560
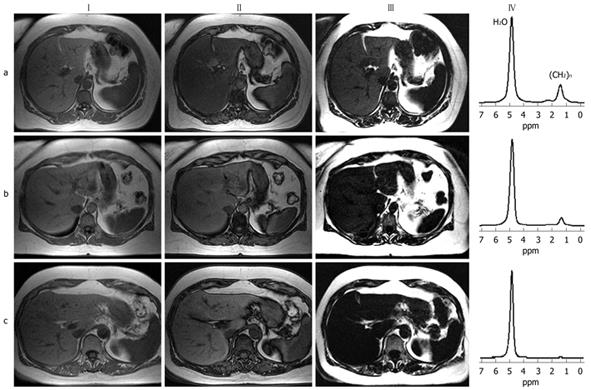
Figure 3 Three subjects with different intrahepatic lipid contents are compared.
The subject in row (a) shows intrahepatic lipid content of about 20%; the subject in row (b) shows intrahepatic lipid content of about 10%; and the subject in row (c) shows intrahepatic lipid content in the normal range (about 1%). The figure shows IP (column I) and OP (column II) images of a T1-weighted gradient echo sequence. Column III shows the results of a fat-selective spectral-spatial imaging sequence, and column IV shows the results from single-volume 1H-MRS using a STEAM sequence.
- Citation: Springer F, Machann J, Claussen CD, Schick F, Schwenzer NF. Liver fat content determined by magnetic resonance imaging and spectroscopy. World J Gastroenterol 2010; 16(13): 1560-1566
- URL: https://www.wjgnet.com/1007-9327/full/v16/i13/1560.htm
- DOI: https://dx.doi.org/10.3748/wjg.v16.i13.1560


