Copyright
©2010 Baishideng.
World J Gastroenterol. Mar 28, 2010; 16(12): 1473-1481
Published online Mar 28, 2010. doi: 10.3748/wjg.v16.i12.1473
Published online Mar 28, 2010. doi: 10.3748/wjg.v16.i12.1473
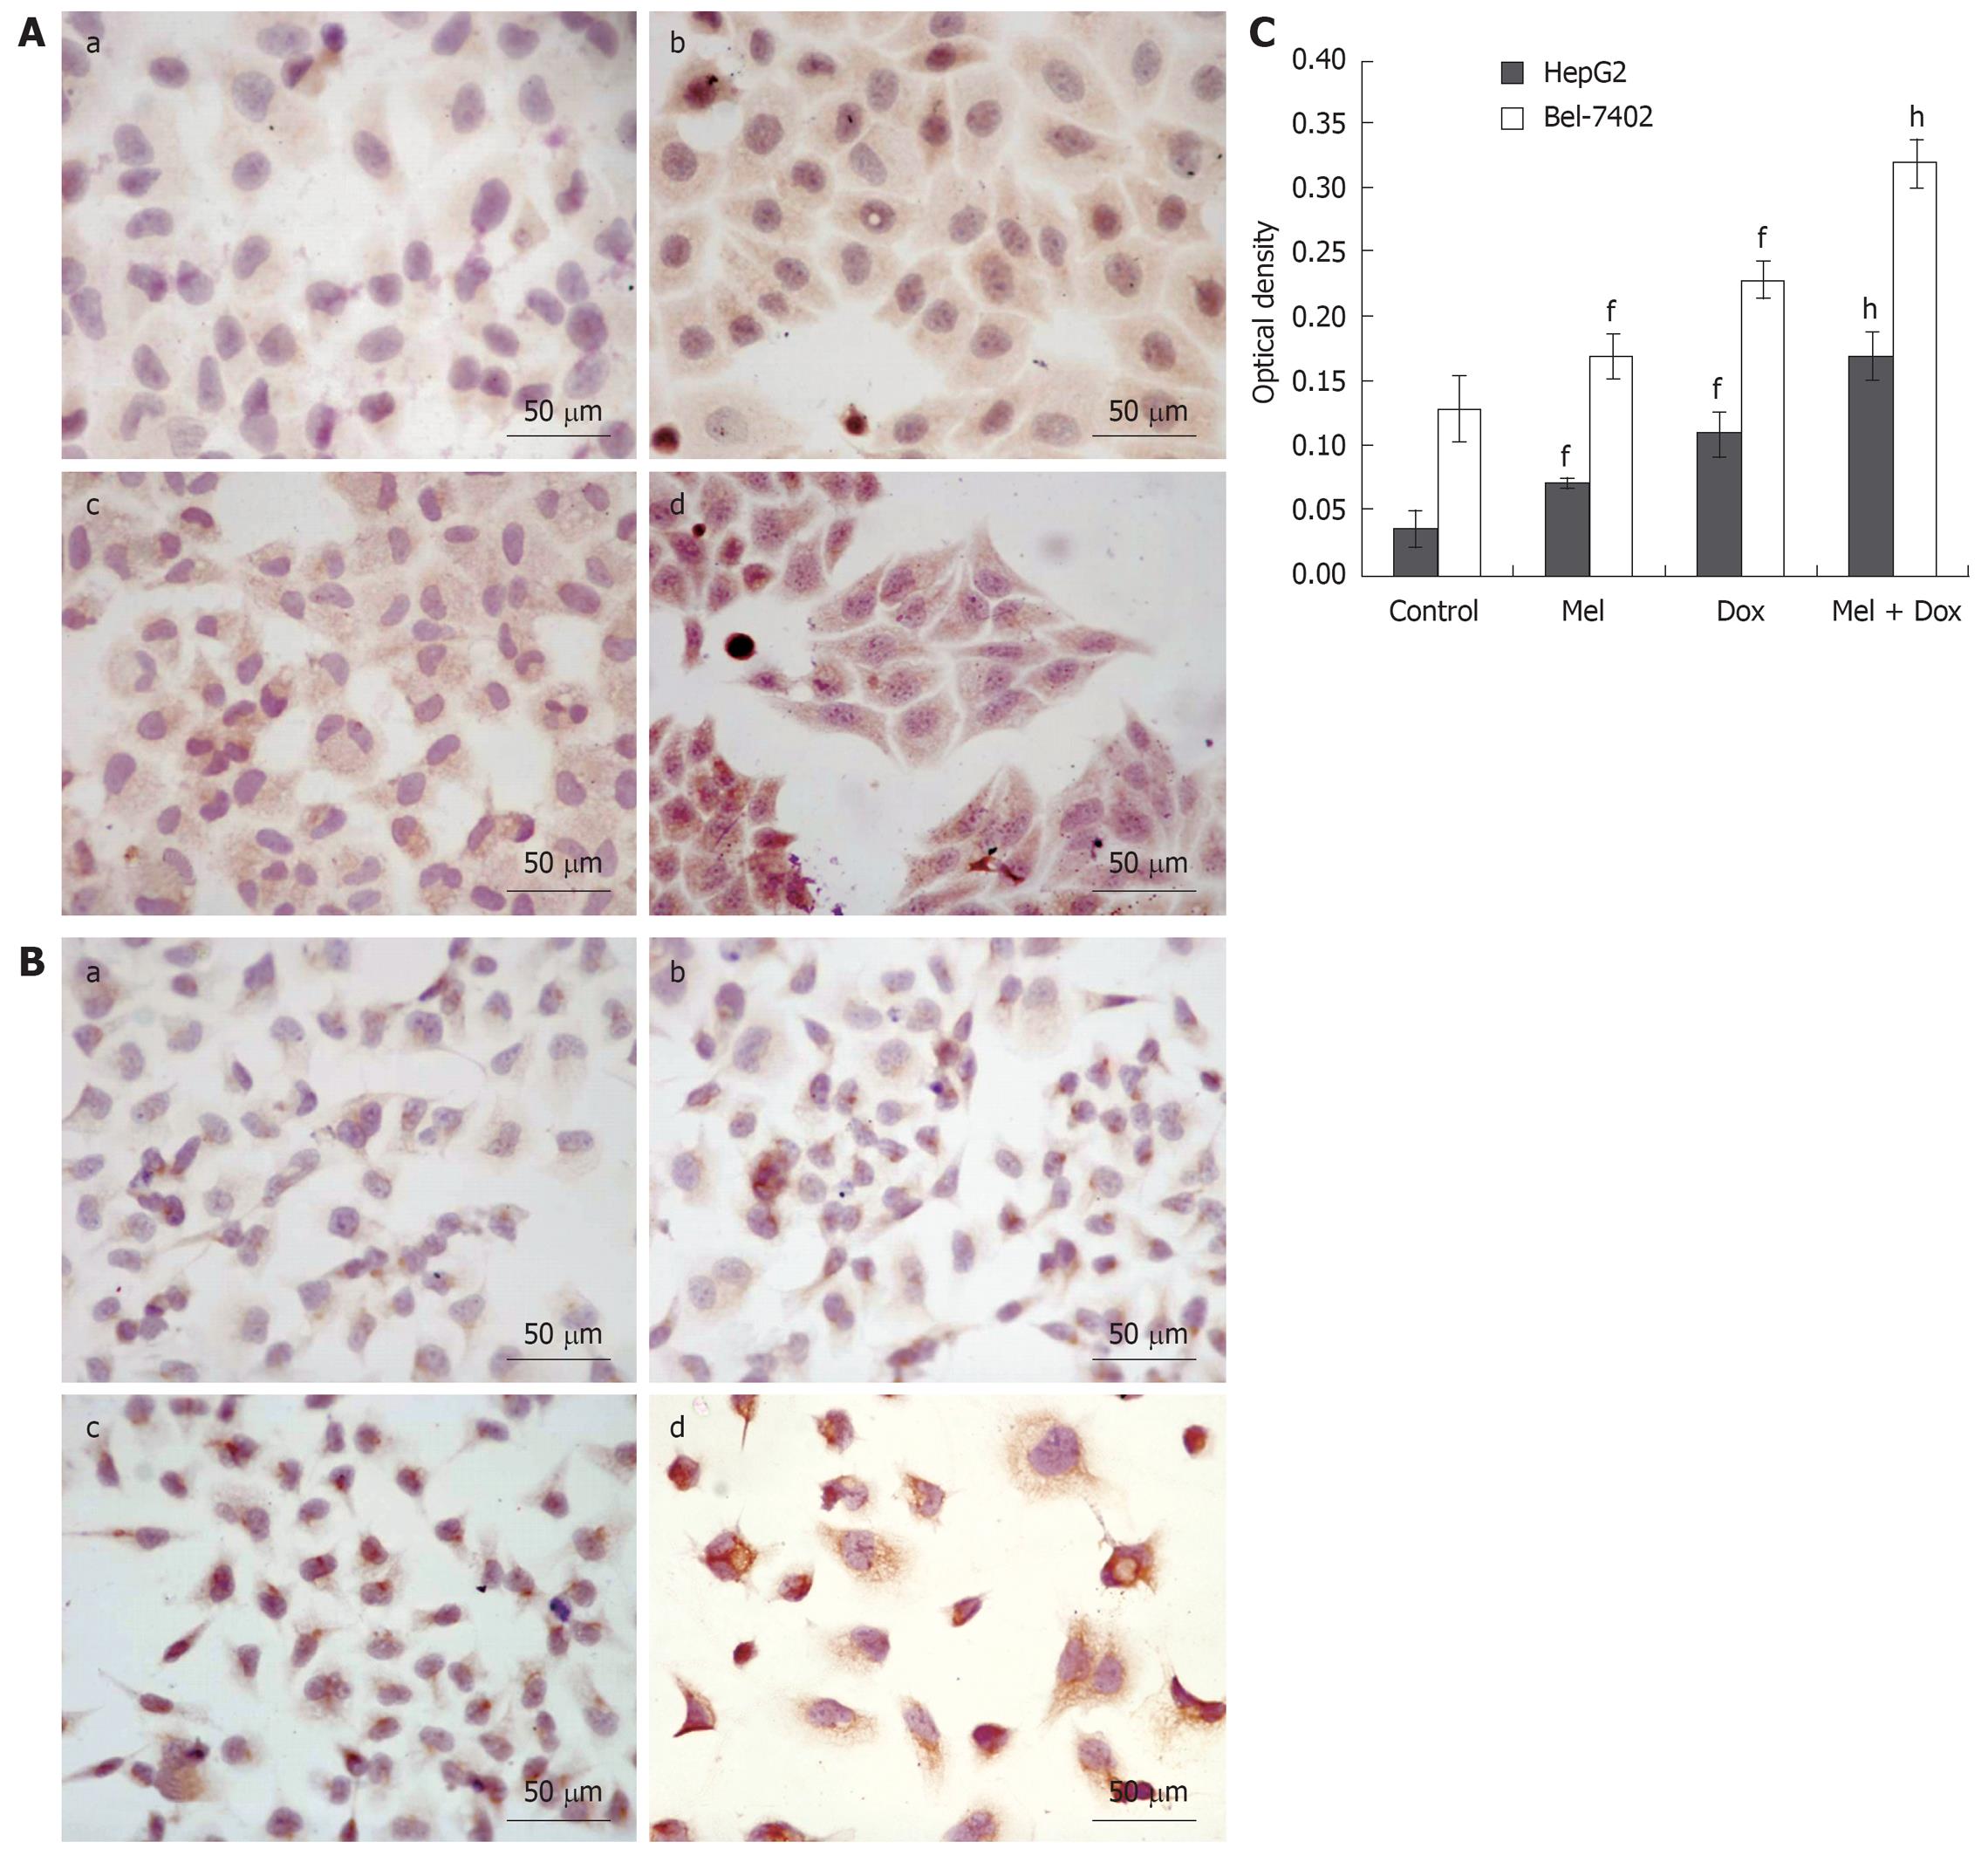
Figure 6 Effect of Melatonin and/or Doxorubicin on the expression of Casepase-3 in HepG2 (A) and Bel-7402 cells (B), and the quantitative analysis (C) of Caspase-3 expression.
A: (a) Untreated cells; (b) 10-5 mol/LMel; (c) 1.25 mg/L Dox; (d) 10-5 mol/L Mel plus 1.25 mg/L Dox; B: (a) Untreated cells; (b) 10-5 mol/L Mel; (c) 2.5 mg/L Dox; (d) 10-5 mol/L Mel plus 2.5 mg/L Dox. S-P (× 400); C: Quantitative analysis of Caspase-3 expression by Biological Image Analysis System. Data are presented as mean ± SD (error bar). fP < 0.01 vs control of Caspase-3, hP < 0.01 vs Dox alone.
- Citation: Fan LL, Sun GP, Wei W, Wang ZG, Ge L, Fu WZ, Wang H. Melatonin and Doxorubicin synergistically induce cell apoptosis in human hepatoma cell lines. World J Gastroenterol 2010; 16(12): 1473-1481
- URL: https://www.wjgnet.com/1007-9327/full/v16/i12/1473.htm
- DOI: https://dx.doi.org/10.3748/wjg.v16.i12.1473


