Copyright
©2010 Baishideng.
World J Gastroenterol. Mar 21, 2010; 16(11): 1385-1396
Published online Mar 21, 2010. doi: 10.3748/wjg.v16.i11.1385
Published online Mar 21, 2010. doi: 10.3748/wjg.v16.i11.1385
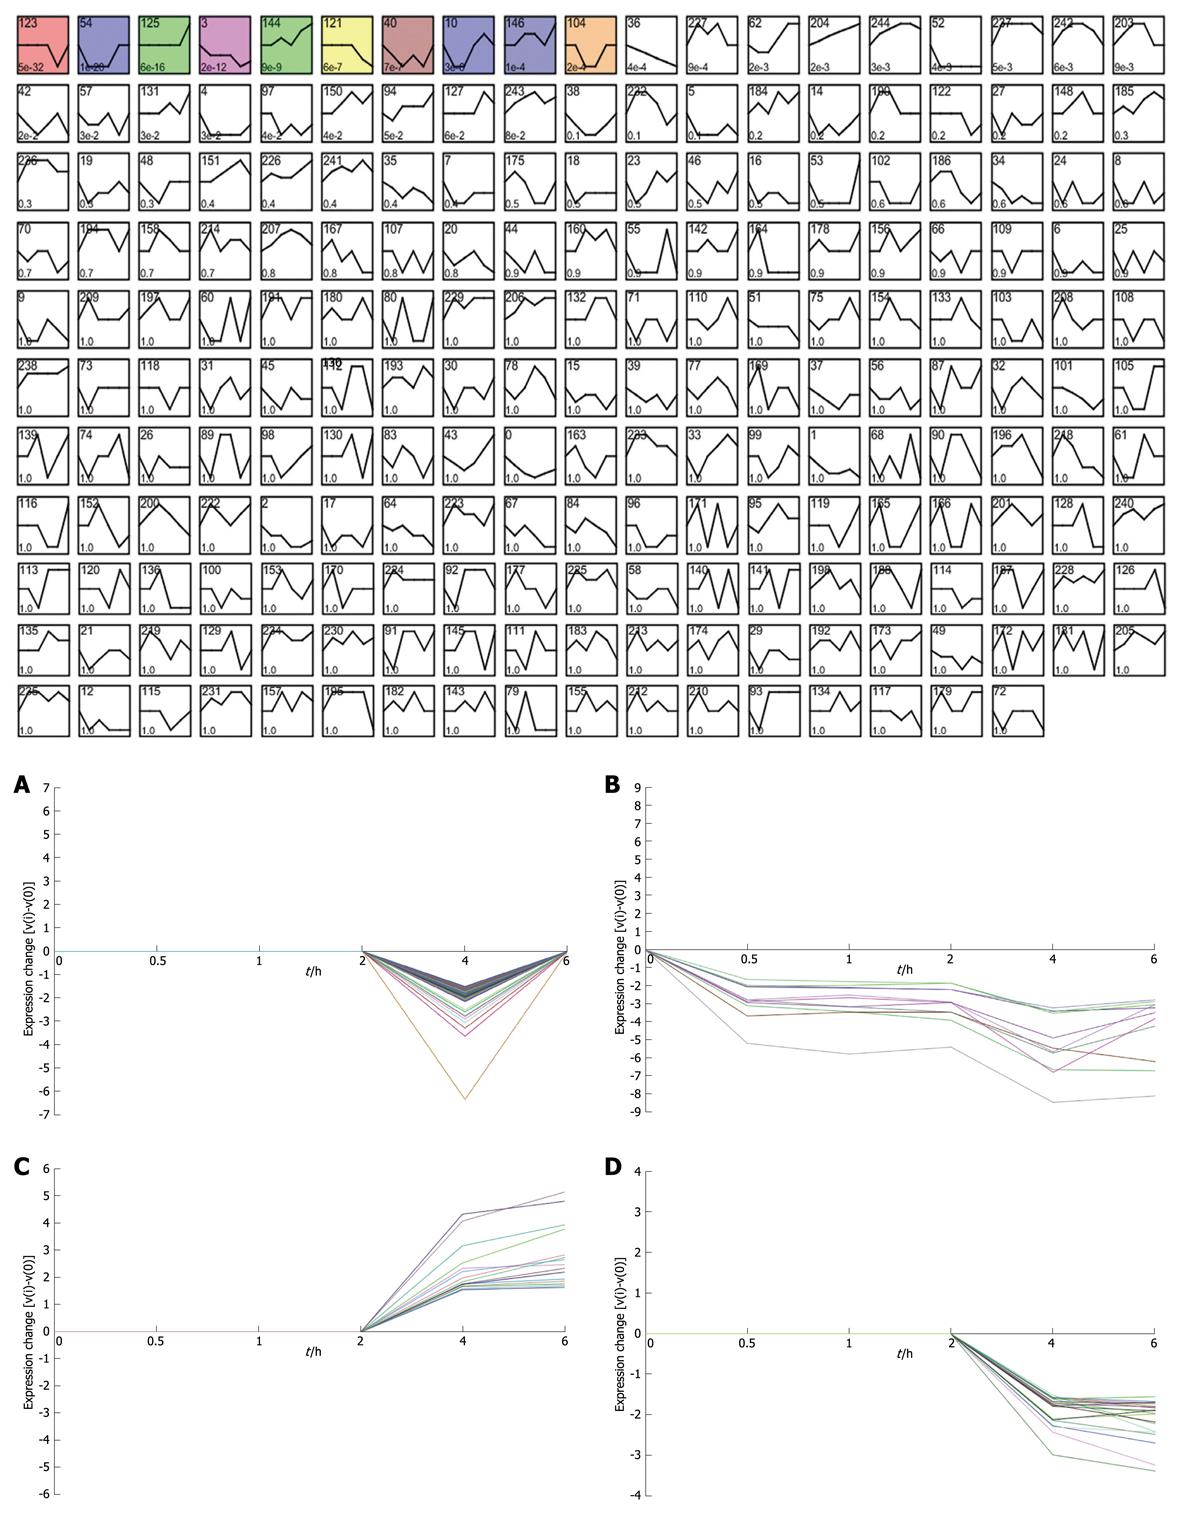
Figure 2 Short time-series expression miner (STEM) clustering of the differentially expressed genes.
All profiles are ordered based on the P value significance of the number of genes assigned vs expected. A: Profile 123 (0, 0, 0, 0, -1, 0): 126.0 genes assigned, 37.8 genes expected, P-value = 5.4E-32 (significant); B: Profile 3 (0, -2, -2, -2, -4, -3): 11.0 genes assigned, 0.4 genes expected, P-value = 1.9E-12 (significant); C: Profile 144 (0, 0, 1, 0, 2, 3): 16.0 genes assigned, 2.5 genes expected, P-value = 8.5E-9 (significant); D: Profile 121 (0, 0, 0, 0, -2, -3): 21.0 genes assigned, 5.7 genes expected, P-value = 6.3E-7 (significant).
-
Citation: You YH, Song YY, Meng FL, He LH, Zhang MJ, Yan XM, Zhang JZ. Time-series gene expression profiles in AGS cells stimulated with
Helicobacter pylori . World J Gastroenterol 2010; 16(11): 1385-1396 - URL: https://www.wjgnet.com/1007-9327/full/v16/i11/1385.htm
- DOI: https://dx.doi.org/10.3748/wjg.v16.i11.1385


