Copyright
©2010 Baishideng.
World J Gastroenterol. Mar 21, 2010; 16(11): 1385-1396
Published online Mar 21, 2010. doi: 10.3748/wjg.v16.i11.1385
Published online Mar 21, 2010. doi: 10.3748/wjg.v16.i11.1385
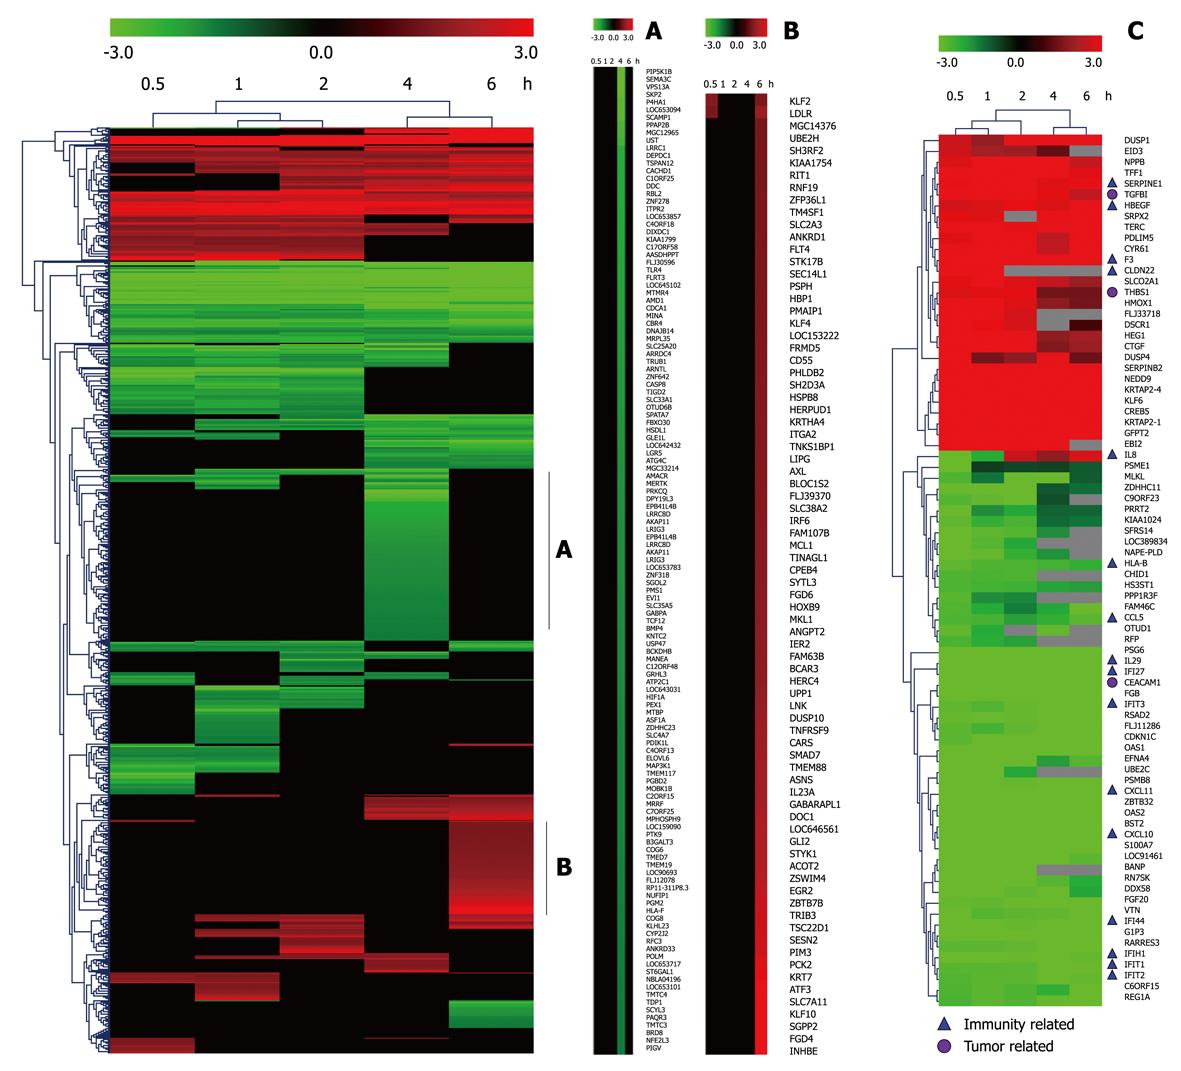
Figure 1 Hierarchical cluster analysis of time-series gene expression alteration after infection of Helicobacter pylori at 5 time points.
Genes that significantly changed during infection were included in hierarchical clustering analysis using average linkage and Euclidean dissimilarity methods. Significant clusters A and B show the details of genes including name of the gene down-regulated at 4 h and up-regulated at 6 h. Eighty of the most differentially expressed genes were clustered in C. Immunity and tumor related genes are labeled.
-
Citation: You YH, Song YY, Meng FL, He LH, Zhang MJ, Yan XM, Zhang JZ. Time-series gene expression profiles in AGS cells stimulated with
Helicobacter pylori . World J Gastroenterol 2010; 16(11): 1385-1396 - URL: https://www.wjgnet.com/1007-9327/full/v16/i11/1385.htm
- DOI: https://dx.doi.org/10.3748/wjg.v16.i11.1385


