Copyright
©2010 Baishideng.
World J Gastroenterol. Mar 14, 2010; 16(10): 1267-1273
Published online Mar 14, 2010. doi: 10.3748/wjg.v16.i10.1267
Published online Mar 14, 2010. doi: 10.3748/wjg.v16.i10.1267
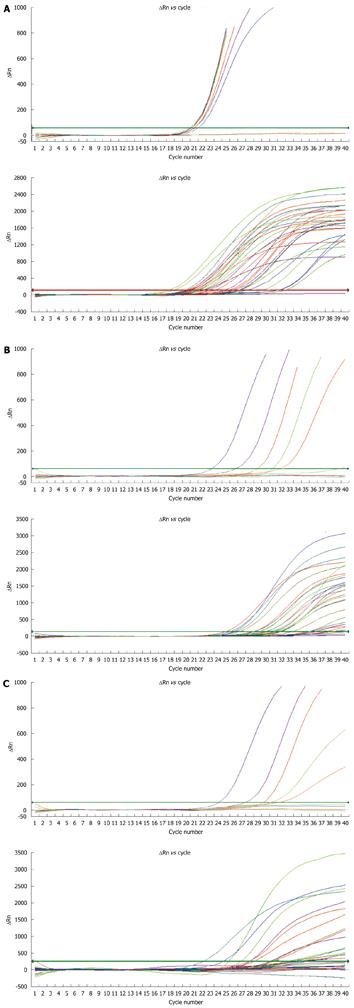
Figure 2 Real-time fluorescent quantitative PCR amplification curves for the sensitivity of mixed variants (the upper part of each diagram) and patients (the lower part of each diagram) to the new method.
A: Total HBV DNA; B: rtA181 mutation HBV DNA; C: rtN236T mutation HBV DNA.
- Citation: Zhao WF, Shao YL, Chen LY, Wu JH, Zhu YL, Gan JH, Xiong H. Establishment of a new quantitative detection approach to adefovir-resistant HBV and its clinical application. World J Gastroenterol 2010; 16(10): 1267-1273
- URL: https://www.wjgnet.com/1007-9327/full/v16/i10/1267.htm
- DOI: https://dx.doi.org/10.3748/wjg.v16.i10.1267


