Copyright
©2010 Baishideng.
World J Gastroenterol. Jan 7, 2010; 16(1): 48-55
Published online Jan 7, 2010. doi: 10.3748/wjg.v16.i1.48
Published online Jan 7, 2010. doi: 10.3748/wjg.v16.i1.48
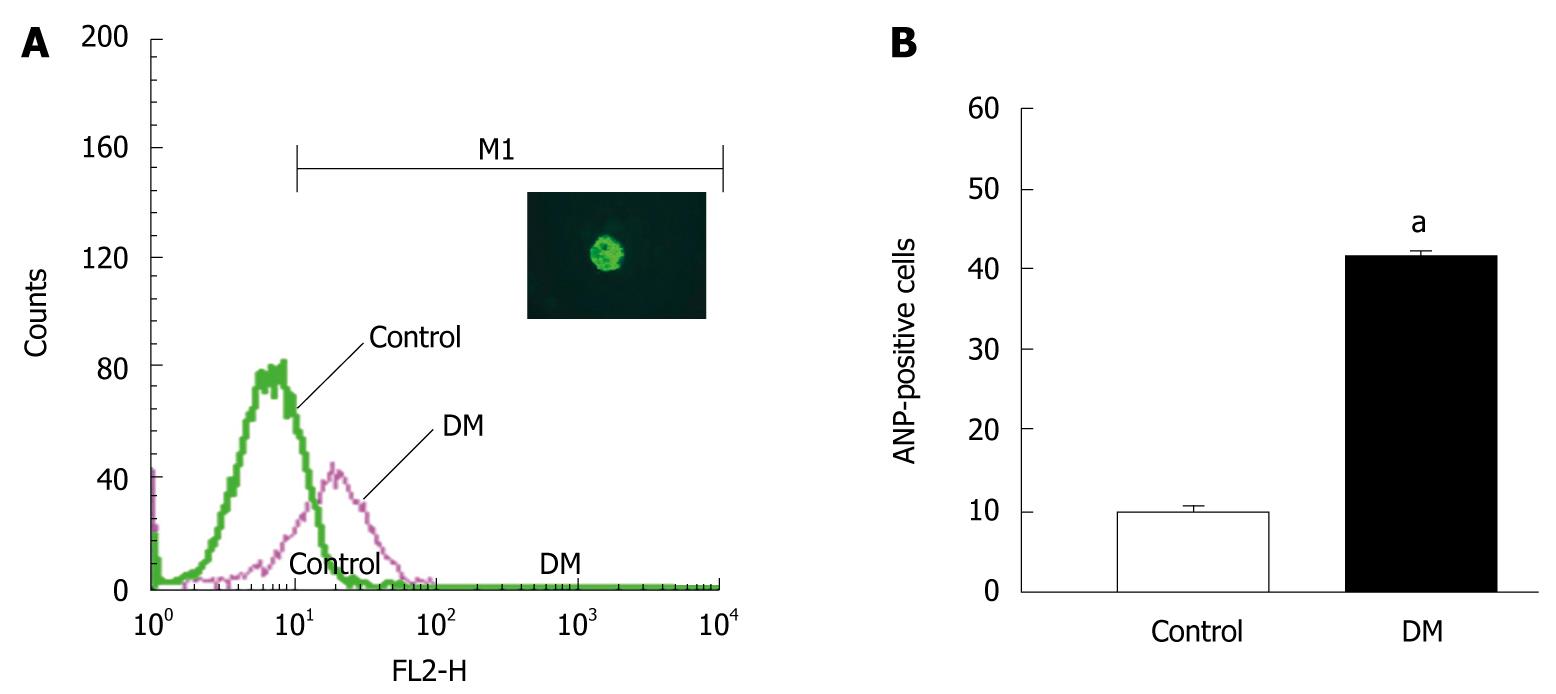
Figure 3 Flow cytometric analysis of ANP-positive cells among gastric mucosal cells.
The percentage of ANP-positive cells was determined by flow cytometry with FITC-conjugated goat anti-rabbit IgG. A: Relative fluorescence intensity of gastric mucosal cells in the control and diabetic groups. M1 indicates the proportions of ANP-positive cells that displayed positive FITC labeling. The inserted fluorescent image is a single ANP-positive cell that had a positive fluorescent signal in its cytoplasm (× 400); B: ANP-positive cells among the gastric mucosal cells (104 cells per sample) in control and STZ-induced diabetic mice (n = 3, aP < 0.05 vs control).
- Citation: Qiu ZX, Mei B, Wu YS, Huang X, Wang ZY, Han YF, Lu HL, Kim YC, Xu WX. Atrial natriuretic peptide signal pathway upregulated in stomach of streptozotocin-induced diabetic mice. World J Gastroenterol 2010; 16(1): 48-55
- URL: https://www.wjgnet.com/1007-9327/full/v16/i1/48.htm
- DOI: https://dx.doi.org/10.3748/wjg.v16.i1.48


