Copyright
©2010 Baishideng.
World J Gastroenterol. Jan 7, 2010; 16(1): 48-55
Published online Jan 7, 2010. doi: 10.3748/wjg.v16.i1.48
Published online Jan 7, 2010. doi: 10.3748/wjg.v16.i1.48
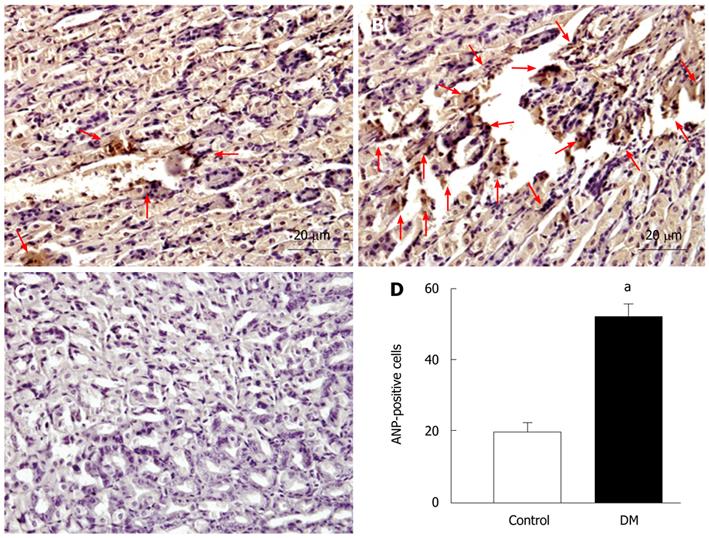
Figure 2 Immunohistochemical analysis of atrial natriuretic peptide (ANP) in mouse gastric tissue.
The photographs show ANP expression in gastric mucosa in the control group (A), STZ-induced diabetic group (B), and negative control group (C); The paranuclear cytoplasmic stained cells that display an intense dark brown color were ANP-positive-staining cells in the mucosa. The red arrows indicate ANP-positive cells; B shows that the number of ANP-positive cells increased in the STZ-induced diabetic group; D shows the density index that referred to the number of ANP-positive cells per field of vision (n = 8, aP < 0.05 vs control group). Scale bar = 20 μm.
- Citation: Qiu ZX, Mei B, Wu YS, Huang X, Wang ZY, Han YF, Lu HL, Kim YC, Xu WX. Atrial natriuretic peptide signal pathway upregulated in stomach of streptozotocin-induced diabetic mice. World J Gastroenterol 2010; 16(1): 48-55
- URL: https://www.wjgnet.com/1007-9327/full/v16/i1/48.htm
- DOI: https://dx.doi.org/10.3748/wjg.v16.i1.48


