Copyright
©2009 The WJG Press and Baishideng.
World J Gastroenterol. Feb 28, 2009; 15(8): 973-977
Published online Feb 28, 2009. doi: 10.3748/wjg.15.973
Published online Feb 28, 2009. doi: 10.3748/wjg.15.973
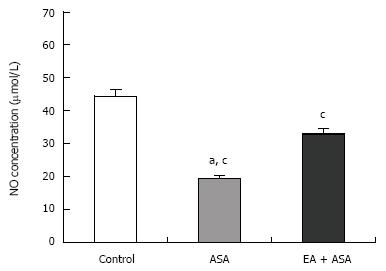
Figure 4 Total nitric oxide (NO) concentration of each group.
Values are each a mean ± SE (n = 5 each group). aP < 0.05 compared with Control; cP < 0.05 compared with ASA group. Control: Distilled water, ASA: Acetylsalicylic acid (100 mg/kg); EA: Electro-acupuncture.
- Citation: Hwang HS, Han KJ, Ryu YH, Yang EJ, Kim YS, Jeong SY, Lee YS, Lee MS, Sung Tae K, Sun-Mi C. Protective effects of electroacupuncture on acetylsalicylic acid-induced acute gastritis in rats. World J Gastroenterol 2009; 15(8): 973-977
- URL: https://www.wjgnet.com/1007-9327/full/v15/i8/973.htm
- DOI: https://dx.doi.org/10.3748/wjg.15.973


