Copyright
©2009 The WJG Press and Baishideng.
World J Gastroenterol. Feb 14, 2009; 15(6): 717-721
Published online Feb 14, 2009. doi: 10.3748/wjg.15.717
Published online Feb 14, 2009. doi: 10.3748/wjg.15.717
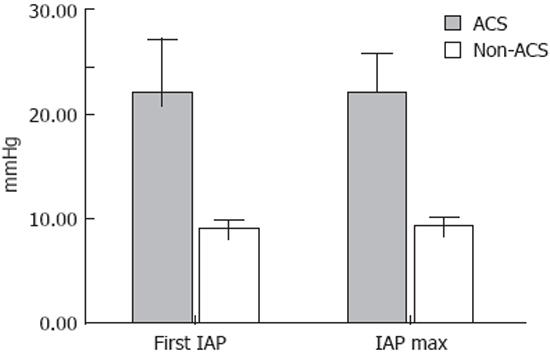
Figure 1 The 1st IAP and maximal IAP value in ACS and non-ACS groups.
All patients were divided in ACS (grey colour) and non-ACS (white colour) groups. Median IAP at admission was 22.0 and 9.25 mmHg in ACS and non-ACS groups respectively (P < 0.01). There was no significant difference between value of the 1st measurement and maximum observed value of IAP within each group.
- Citation: Dambrauskas Z, Parseliunas A, Gulbinas A, Pundzius J, Barauskas G. Early recognition of abdominal compartment syndrome in patients with acute pancreatitis. World J Gastroenterol 2009; 15(6): 717-721
- URL: https://www.wjgnet.com/1007-9327/full/v15/i6/717.htm
- DOI: https://dx.doi.org/10.3748/wjg.15.717


