Copyright
©2009 The WJG Press and Baishideng.
World J Gastroenterol. Feb 14, 2009; 15(6): 697-704
Published online Feb 14, 2009. doi: 10.3748/wjg.15.697
Published online Feb 14, 2009. doi: 10.3748/wjg.15.697
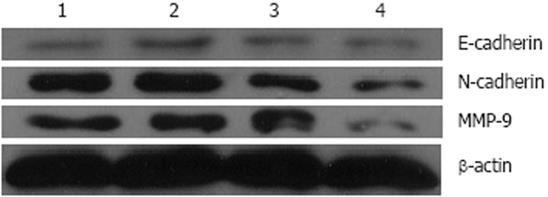
Figure 4 E-cadherin, N-cadherin and MMP-9 proteins detected by Western bloting.
1: Positive control; 2: Untreated EC9706 cells; 3: EC9706 cells with control vector; 4: EC9706 cells with N-cadherin RNAi. E-cadherin proteins were 0.247 ± 0.010, 0.252 ± 0.087, 0.249 ± 0.07 and 0.250 ± 0.006, respectively, from lane 1 to lane 4. P > 0.05. The N-cadherin proteins were 0.681 ± 0.003, 0.679 ± 0.004, 0.653 ± 0.009 and 0.342 ± 0.006, respectively, from lane 1 to lane 4. P < 0.05. The MMP-9 proteins were 0.624 ± 0.011, 0.628 ± 0.010, 0.623 ± 0.009 and 0.282 ± 0.010, respectively, from lane 1 to lane 4. P < 0.05.
-
Citation: Li K, He W, Lin N, Wang X, Fan QX. N-cadherin knock-down decreases invasiveness of esophageal squamous cell carcinoma
in vitro . World J Gastroenterol 2009; 15(6): 697-704 - URL: https://www.wjgnet.com/1007-9327/full/v15/i6/697.htm
- DOI: https://dx.doi.org/10.3748/wjg.15.697


