Copyright
©2009 The WJG Press and Baishideng.
World J Gastroenterol. Dec 7, 2009; 15(45): 5693-5699
Published online Dec 7, 2009. doi: 10.3748/wjg.15.5693
Published online Dec 7, 2009. doi: 10.3748/wjg.15.5693
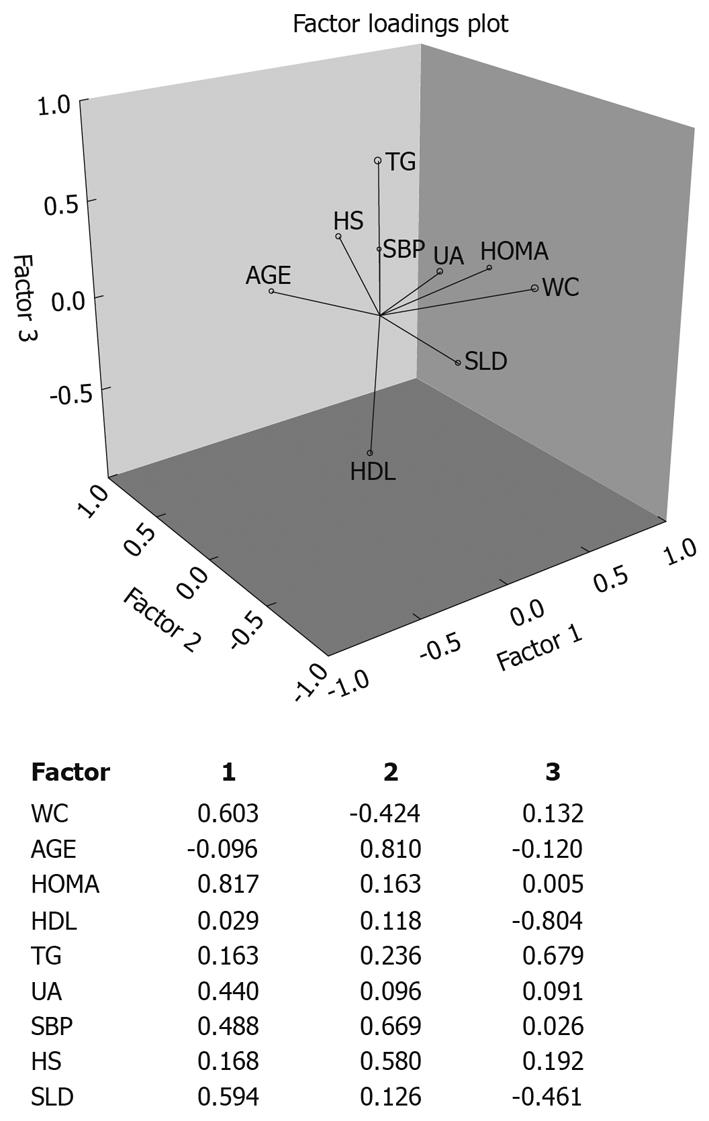
Figure 3 Unravelling the hidden correlations.
Total variance explained by factor: 1 = 20.9%; 2 = 19.36%; WC: Waist circumference; HOMA: HOmeostatic metabolic assessment for insulin resistance; HDL: High-density lipoprotein-cholesterol; TG: Triglycerides; UA: Uric acid; SBP: Systolic blood pressure; HS: Hepatic steatosis at US; SLD: Spleen longitudinal diameter at ultrasonography (US).
- Citation: Tarantino G, Pizza G, Colao A, Pasanisi F, Conca P, Colicchio P, Finelli C, Contaldo F, Di Somma C, Savastano S. Hepatic steatosis in overweight/obese females: New screening method for those at risk. World J Gastroenterol 2009; 15(45): 5693-5699
- URL: https://www.wjgnet.com/1007-9327/full/v15/i45/5693.htm
- DOI: https://dx.doi.org/10.3748/wjg.15.5693


