Copyright
©2009 The WJG Press and Baishideng.
World J Gastroenterol. Dec 7, 2009; 15(45): 5674-5684
Published online Dec 7, 2009. doi: 10.3748/wjg.15.5674
Published online Dec 7, 2009. doi: 10.3748/wjg.15.5674
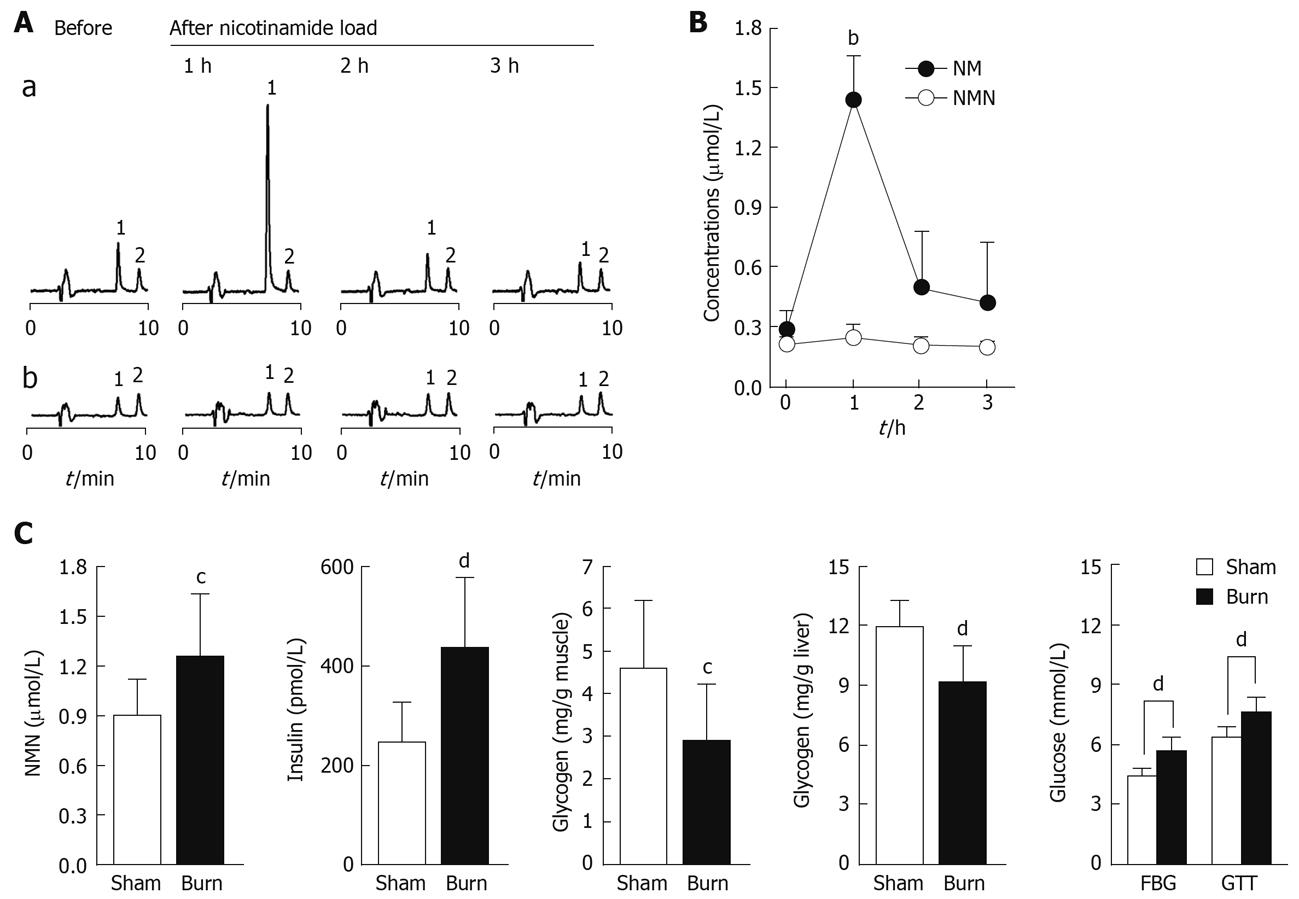
Figure 6 Role of skin in nicotinamide metabolism and insulin resistance.
A: Representative HPLC chromatograms showing changes of sweat nicotinamide (NM) and N1-methylnicotinamide (NMN) concentrations in a subject before and 1, 2 and 3 h after 100 mg nicotinamide loading. 1 and 2 in Aa are NM and internal standard N1-ethylnicotinamide, respectively; 1 and 2 in Ab are NMN and internal standard N1-ethylnicotinamide, respectively; B: Summary of the measurements shown in A. bP < 0.0001 vs control; C: Comparison of plasma NMN and insulin levels, muscle and liver glycogen contents, and blood glucose between sham-burn (n = 7) and burn (n = 11) rats after glucose load. FBG: Fasting blood glucose; GTT: Blood glucose 1 h after glucose injection. Bar graphs show mean ± SD. cP < 0.05, dP < 0.01 vs control.
- Citation: Zhou SS, Li D, Sun WP, Guo M, Lun YZ, Zhou YM, Xiao FC, Jing LX, Sun SX, Zhang LB, Luo N, Bian FN, Zou W, Dong LB, Zhao ZG, Li SF, Gong XJ, Yu ZG, Sun CB, Zheng CL, Jiang DJ, Li ZN. Nicotinamide overload may play a role in the development of type 2 diabetes. World J Gastroenterol 2009; 15(45): 5674-5684
- URL: https://www.wjgnet.com/1007-9327/full/v15/i45/5674.htm
- DOI: https://dx.doi.org/10.3748/wjg.15.5674


