Copyright
©2009 The WJG Press and Baishideng.
World J Gastroenterol. Dec 7, 2009; 15(45): 5674-5684
Published online Dec 7, 2009. doi: 10.3748/wjg.15.5674
Published online Dec 7, 2009. doi: 10.3748/wjg.15.5674
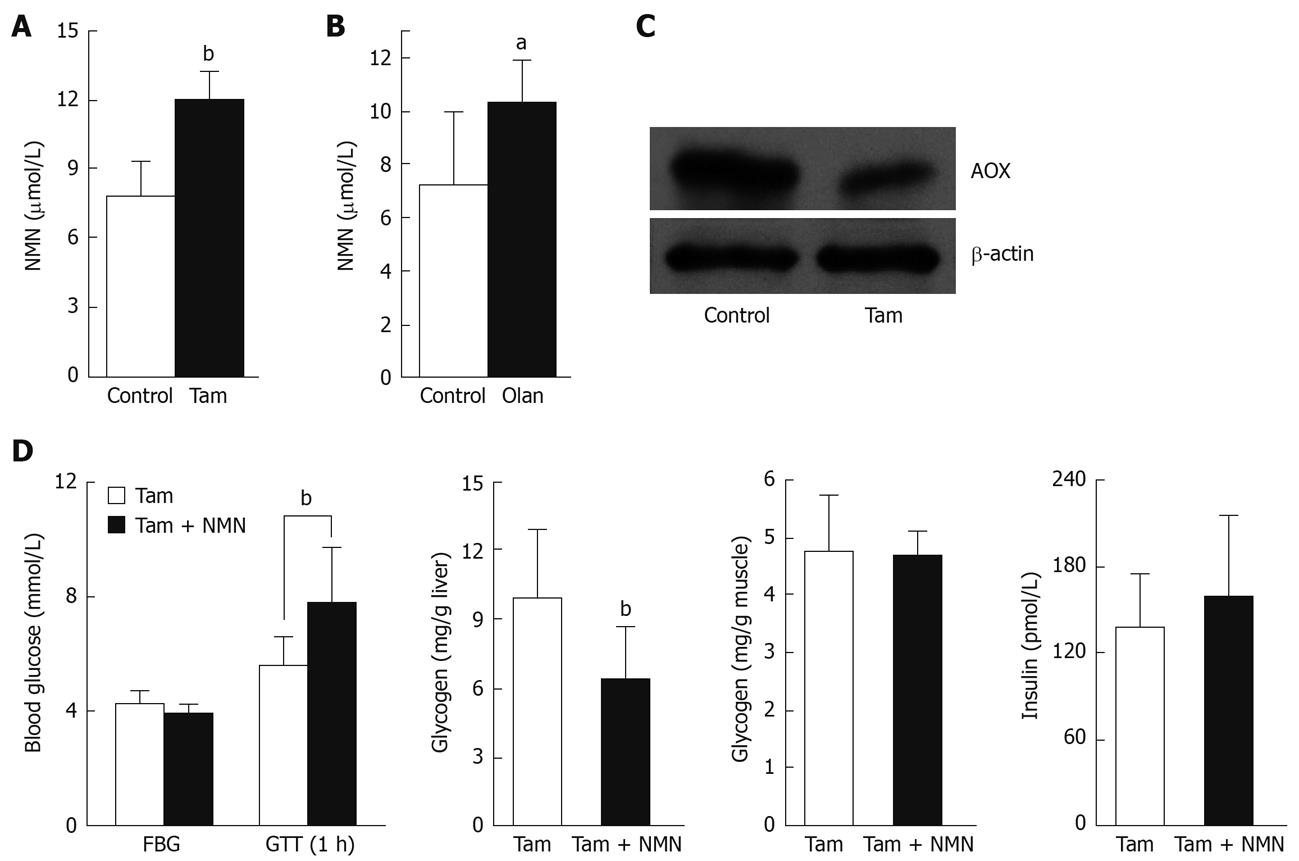
Figure 5 Effects of aldehyde oxidase (AOX) inhibitors on plasma N1-methylnicotinamide levels and glucose metabolism in rats.
A and B: Plasma N1-methylnicotinamide (NMN) levels 5 h after nicotinamide load (100 mg/kg, ip) in rats treated with or without AOX inhibitors tamoxifen (Tam, A) or olanzapine (Olan, B) (each group, n = 6). aP < 0.05 vs control, bP < 0.01 vs control; C: Liver AOX expression in rats with or without 7 wk tamoxifen treatment. The blot is representative of four independent experiments; D: Responses to a glucose tolerance test in rats after 9 wk treatment with tamoxifen with or without NMN (100 mg/kg per day) treatment in the last 2 wk. FBG: Fasting blood glucose; GTT (1 h): Blood glucose measured 1 h after glucose tolerance test. bP < 0.01 vs control. Bar graph indicates mean ± SD.
- Citation: Zhou SS, Li D, Sun WP, Guo M, Lun YZ, Zhou YM, Xiao FC, Jing LX, Sun SX, Zhang LB, Luo N, Bian FN, Zou W, Dong LB, Zhao ZG, Li SF, Gong XJ, Yu ZG, Sun CB, Zheng CL, Jiang DJ, Li ZN. Nicotinamide overload may play a role in the development of type 2 diabetes. World J Gastroenterol 2009; 15(45): 5674-5684
- URL: https://www.wjgnet.com/1007-9327/full/v15/i45/5674.htm
- DOI: https://dx.doi.org/10.3748/wjg.15.5674


