Copyright
©2009 The WJG Press and Baishideng.
World J Gastroenterol. Dec 7, 2009; 15(45): 5674-5684
Published online Dec 7, 2009. doi: 10.3748/wjg.15.5674
Published online Dec 7, 2009. doi: 10.3748/wjg.15.5674
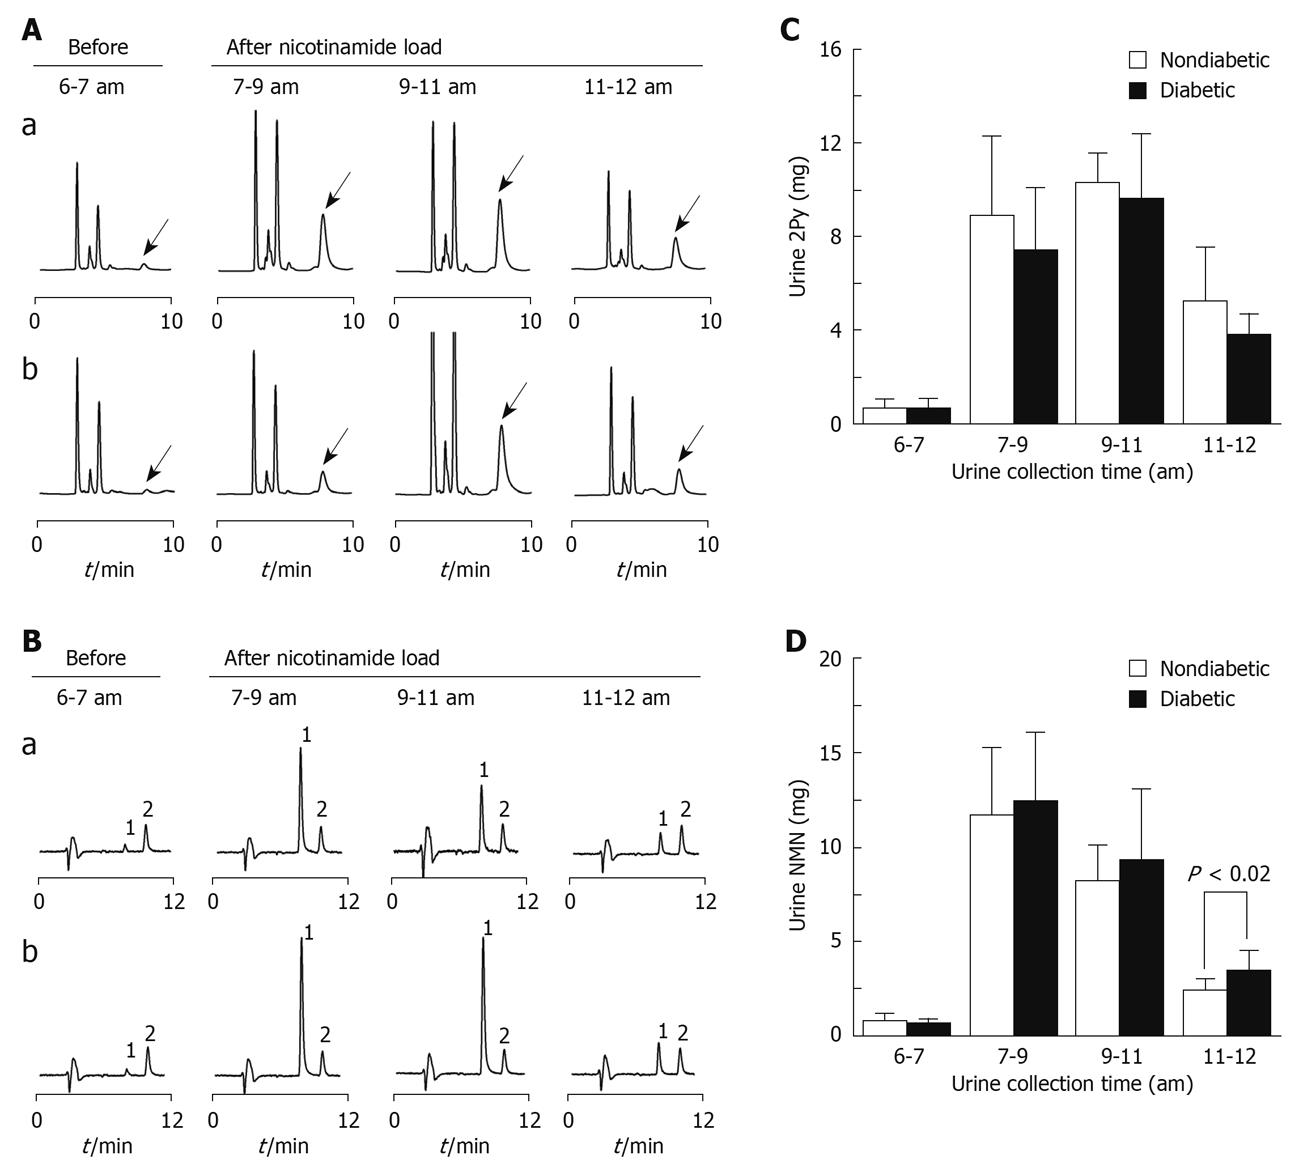
Figure 1 Urinary excretion patterns of 2Py and N1-methylnicotinamide in diabetic and non-diabetic subjects.
A and B: Representative HPLC chromatograms of urinary excretions of 2Py (indicated by arrow) and N1-methylnicotinamide (NMN) of a non-diabetic (Aa and Ba) and a diabetic (Ab and Bb) subject, before and after 100 mg nicotinamide loading at 7:00 am Urine samples taken at given time were normalized to equal volumes before HPLC analysis; C and D: Summaries of the results from the measurements shown in A and B, respectively. Bar graphs indicate mean ± SD.
- Citation: Zhou SS, Li D, Sun WP, Guo M, Lun YZ, Zhou YM, Xiao FC, Jing LX, Sun SX, Zhang LB, Luo N, Bian FN, Zou W, Dong LB, Zhao ZG, Li SF, Gong XJ, Yu ZG, Sun CB, Zheng CL, Jiang DJ, Li ZN. Nicotinamide overload may play a role in the development of type 2 diabetes. World J Gastroenterol 2009; 15(45): 5674-5684
- URL: https://www.wjgnet.com/1007-9327/full/v15/i45/5674.htm
- DOI: https://dx.doi.org/10.3748/wjg.15.5674


