Copyright
©2009 The WJG Press and Baishideng.
World J Gastroenterol. Nov 28, 2009; 15(44): 5579-5585
Published online Nov 28, 2009. doi: 10.3748/wjg.15.5579
Published online Nov 28, 2009. doi: 10.3748/wjg.15.5579
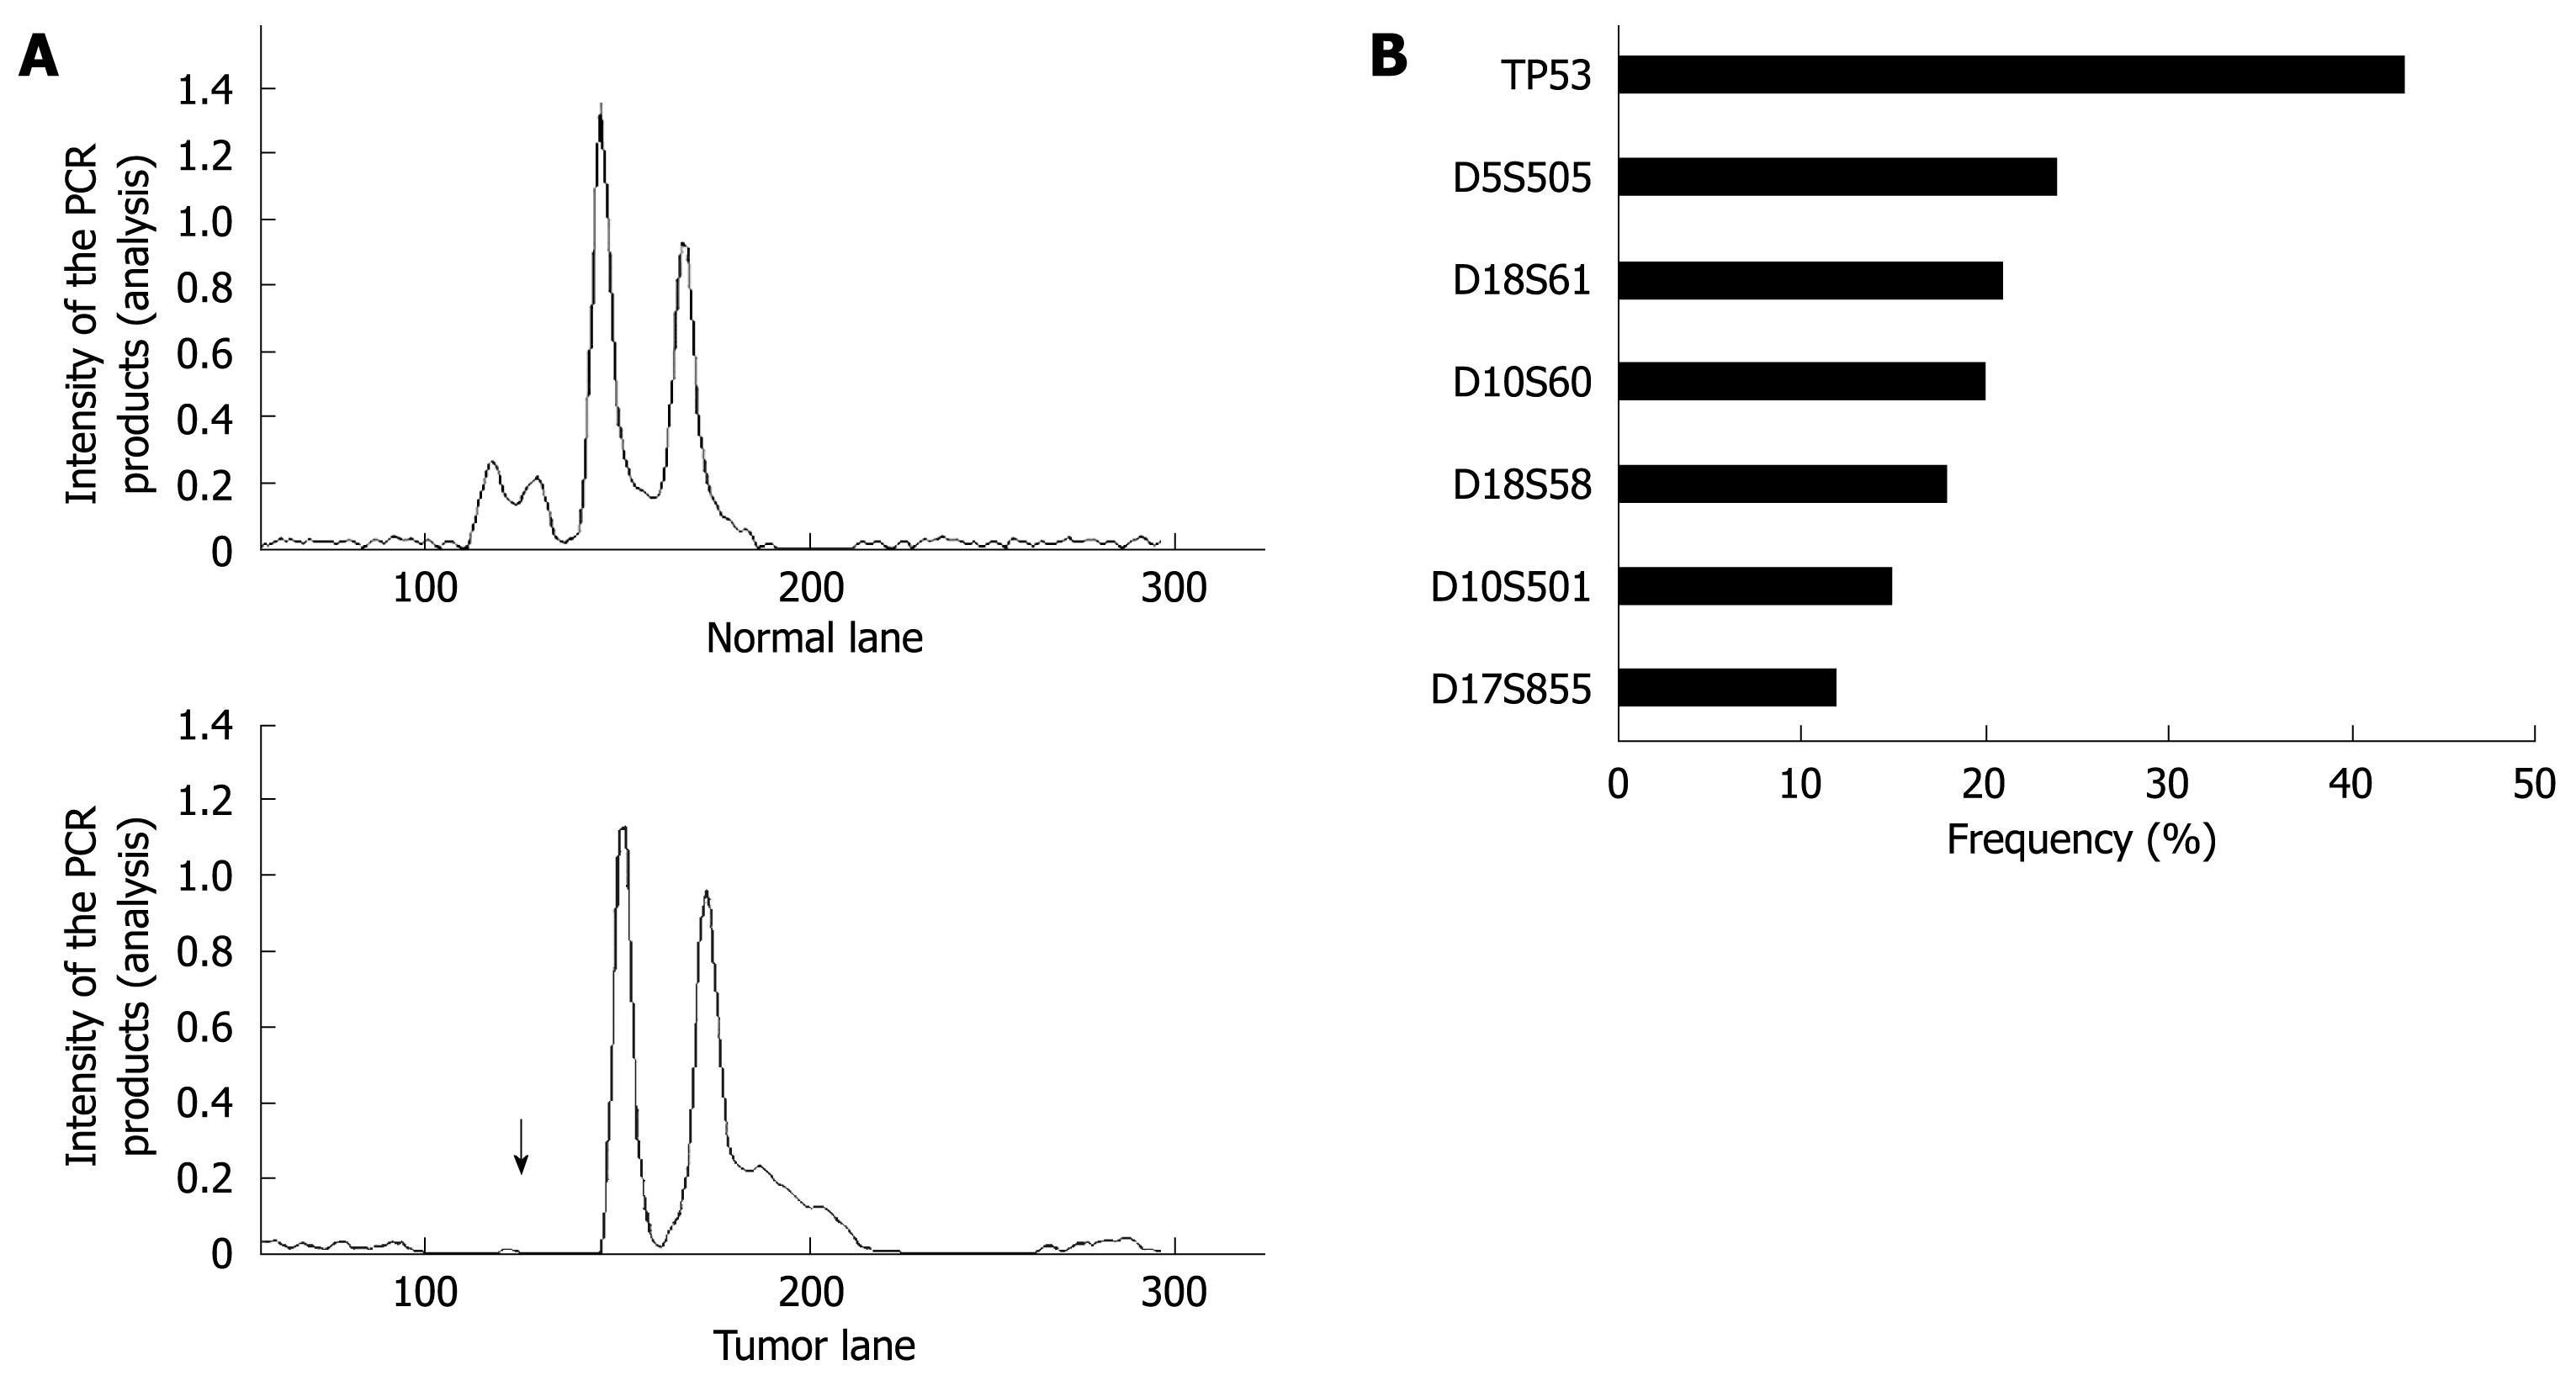
Figure 6 LOH analysis in gastric cancer tissues.
A: A representative example of a tumor with allelic loss in 5q21 (D5S505) is shown. The upper and bottom panels show the intensity plots of both the normal and tumor lane, respectively, demonstrating reduced relative intensity of allele one in the tumor sample (arrow) compared to the corresponding normal sample; B: LOH frequencies based on each individual marker.
- Citation: Yamaoka S, Yamamoto H, Nosho K, Taniguchi H, Adachi Y, Sasaki S, Arimura Y, Imai K, Shinomura Y. Genetic and epigenetic characteristics of gastric cancers with JC virus T-antigen. World J Gastroenterol 2009; 15(44): 5579-5585
- URL: https://www.wjgnet.com/1007-9327/full/v15/i44/5579.htm
- DOI: https://dx.doi.org/10.3748/wjg.15.5579


