Copyright
©2009 The WJG Press and Baishideng.
World J Gastroenterol. Nov 28, 2009; 15(44): 5525-5532
Published online Nov 28, 2009. doi: 10.3748/wjg.15.5525
Published online Nov 28, 2009. doi: 10.3748/wjg.15.5525
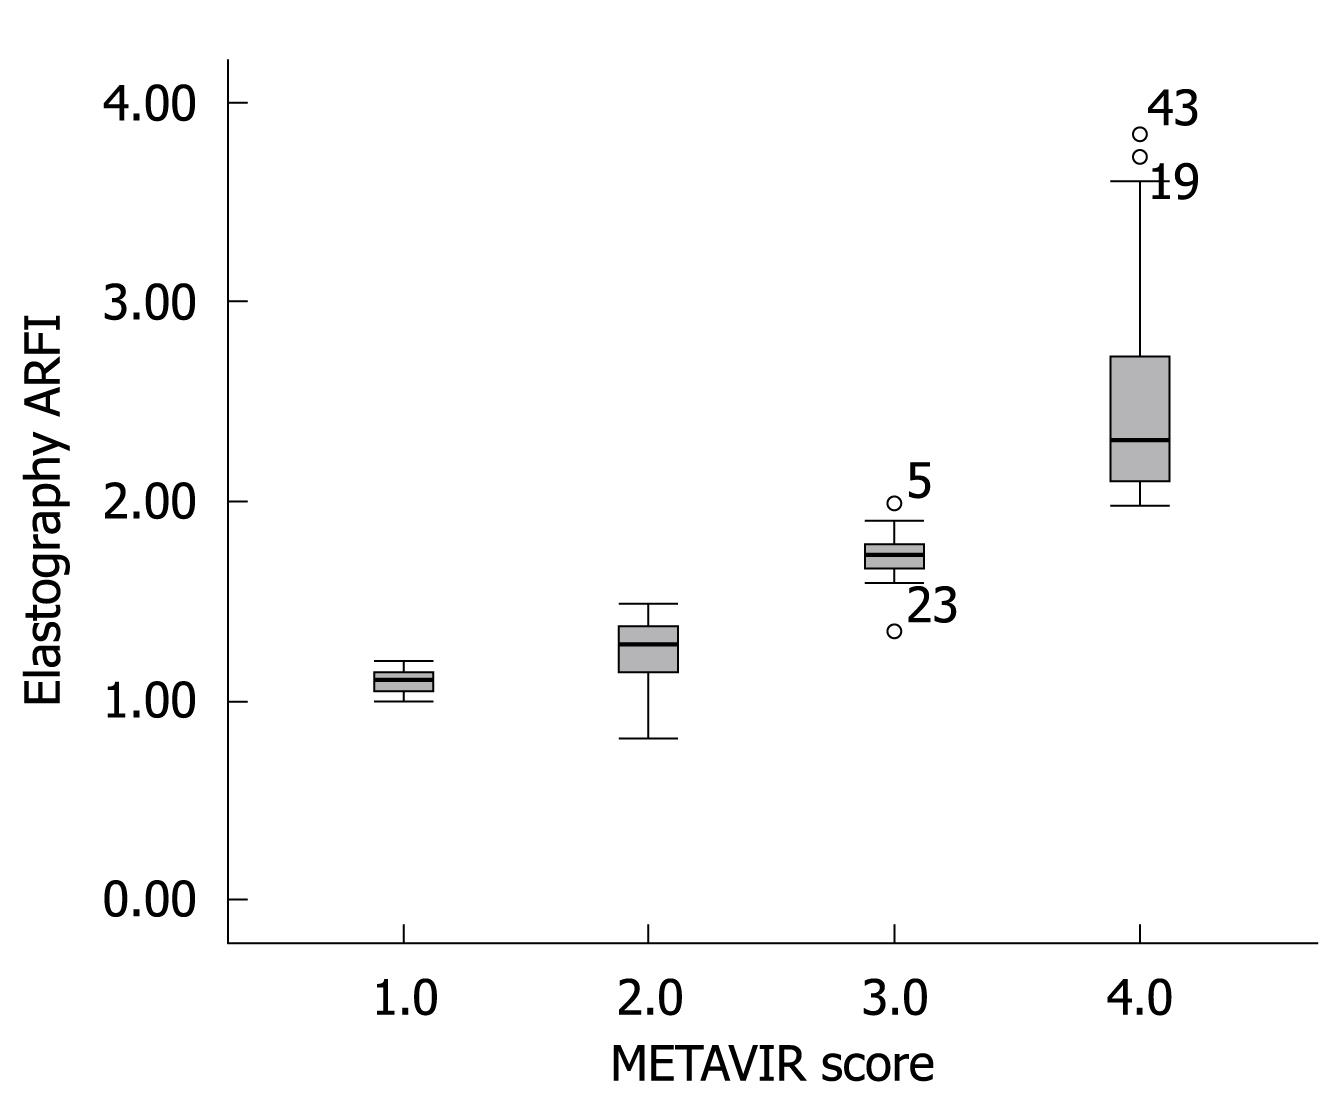
Figure 2 Box plot of METAVIR score and ARFI elastography.
Top and bottom of boxes represent first and third quartiles, respectively. Length of box represents interquartile range within which 50% of values are located. Thick line through each box represents the median. Error bars mark minimum and maximum values (range). Small circles represent outliers. Skewed data for fibrosis stage 0/1 can be explained by the small number of patients in this group.
- Citation: Fierbinteanu-Braticevici C, Andronescu D, Usvat R, Cretoiu D, Baicus C, Marinoschi G. Acoustic radiation force imaging sonoelastography for noninvasive staging of liver fibrosis. World J Gastroenterol 2009; 15(44): 5525-5532
- URL: https://www.wjgnet.com/1007-9327/full/v15/i44/5525.htm
- DOI: https://dx.doi.org/10.3748/wjg.15.5525


