Copyright
©2009 The WJG Press and Baishideng.
World J Gastroenterol. Jan 28, 2009; 15(4): 431-440
Published online Jan 28, 2009. doi: 10.3748/wjg.15.431
Published online Jan 28, 2009. doi: 10.3748/wjg.15.431
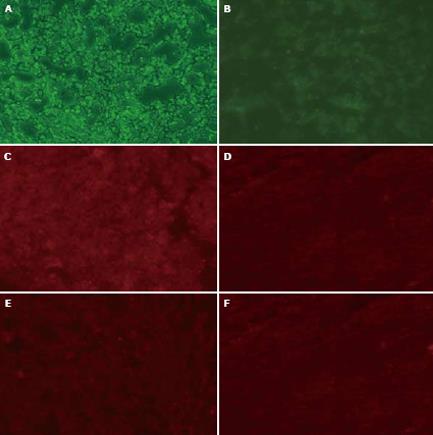
Figure 9 Immunohistochemistry showing green fluorescence in test groups (A) and control groups (B), P-gp expression in test groups (C) and control groups (D), P-gp expression in test groups transfected with in situs injection (E) and intra-abdominal injection of pSUPER-mdr1 (F) (× 200).
The transfection ratio for test groups was higher than that for control groups (86.70% vs 35.20%, P < 0.05). The expression of P-gp in test groups was lower than that in control groups (15.75% vs 97.90%, P < 0.05).
-
Citation: Pan GD, Yang JQ, Yan LN, Chu GP, Liu Q, Xiao Y, Yuan L. Reversal of multi-drug resistance by pSUPER-shRNA-mdr1
in vivo andin vitro . World J Gastroenterol 2009; 15(4): 431-440 - URL: https://www.wjgnet.com/1007-9327/full/v15/i4/431.htm
- DOI: https://dx.doi.org/10.3748/wjg.15.431


