Copyright
©2009 The WJG Press and Baishideng.
World J Gastroenterol. Jan 28, 2009; 15(4): 431-440
Published online Jan 28, 2009. doi: 10.3748/wjg.15.431
Published online Jan 28, 2009. doi: 10.3748/wjg.15.431
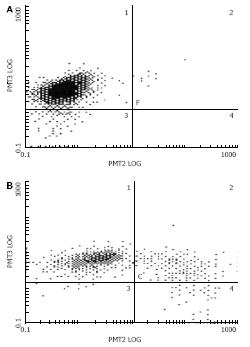
Figure 8 FCM showing lower P-gp expression in HepG2 cells (A) and HepG2/mdr1-shRNA (B) in test groups than in control groups (65% vs 94.
1%, P < 0.05). There was no significant difference between groups treated with in situ injection and intra-abdominal injection of pSUPER-mdr1 (65.1% vs 58.7%).
-
Citation: Pan GD, Yang JQ, Yan LN, Chu GP, Liu Q, Xiao Y, Yuan L. Reversal of multi-drug resistance by pSUPER-shRNA-mdr1
in vivo andin vitro . World J Gastroenterol 2009; 15(4): 431-440 - URL: https://www.wjgnet.com/1007-9327/full/v15/i4/431.htm
- DOI: https://dx.doi.org/10.3748/wjg.15.431


