Copyright
©2009 The WJG Press and Baishideng.
World J Gastroenterol. Oct 7, 2009; 15(37): 4695-4708
Published online Oct 7, 2009. doi: 10.3748/wjg.15.4695
Published online Oct 7, 2009. doi: 10.3748/wjg.15.4695
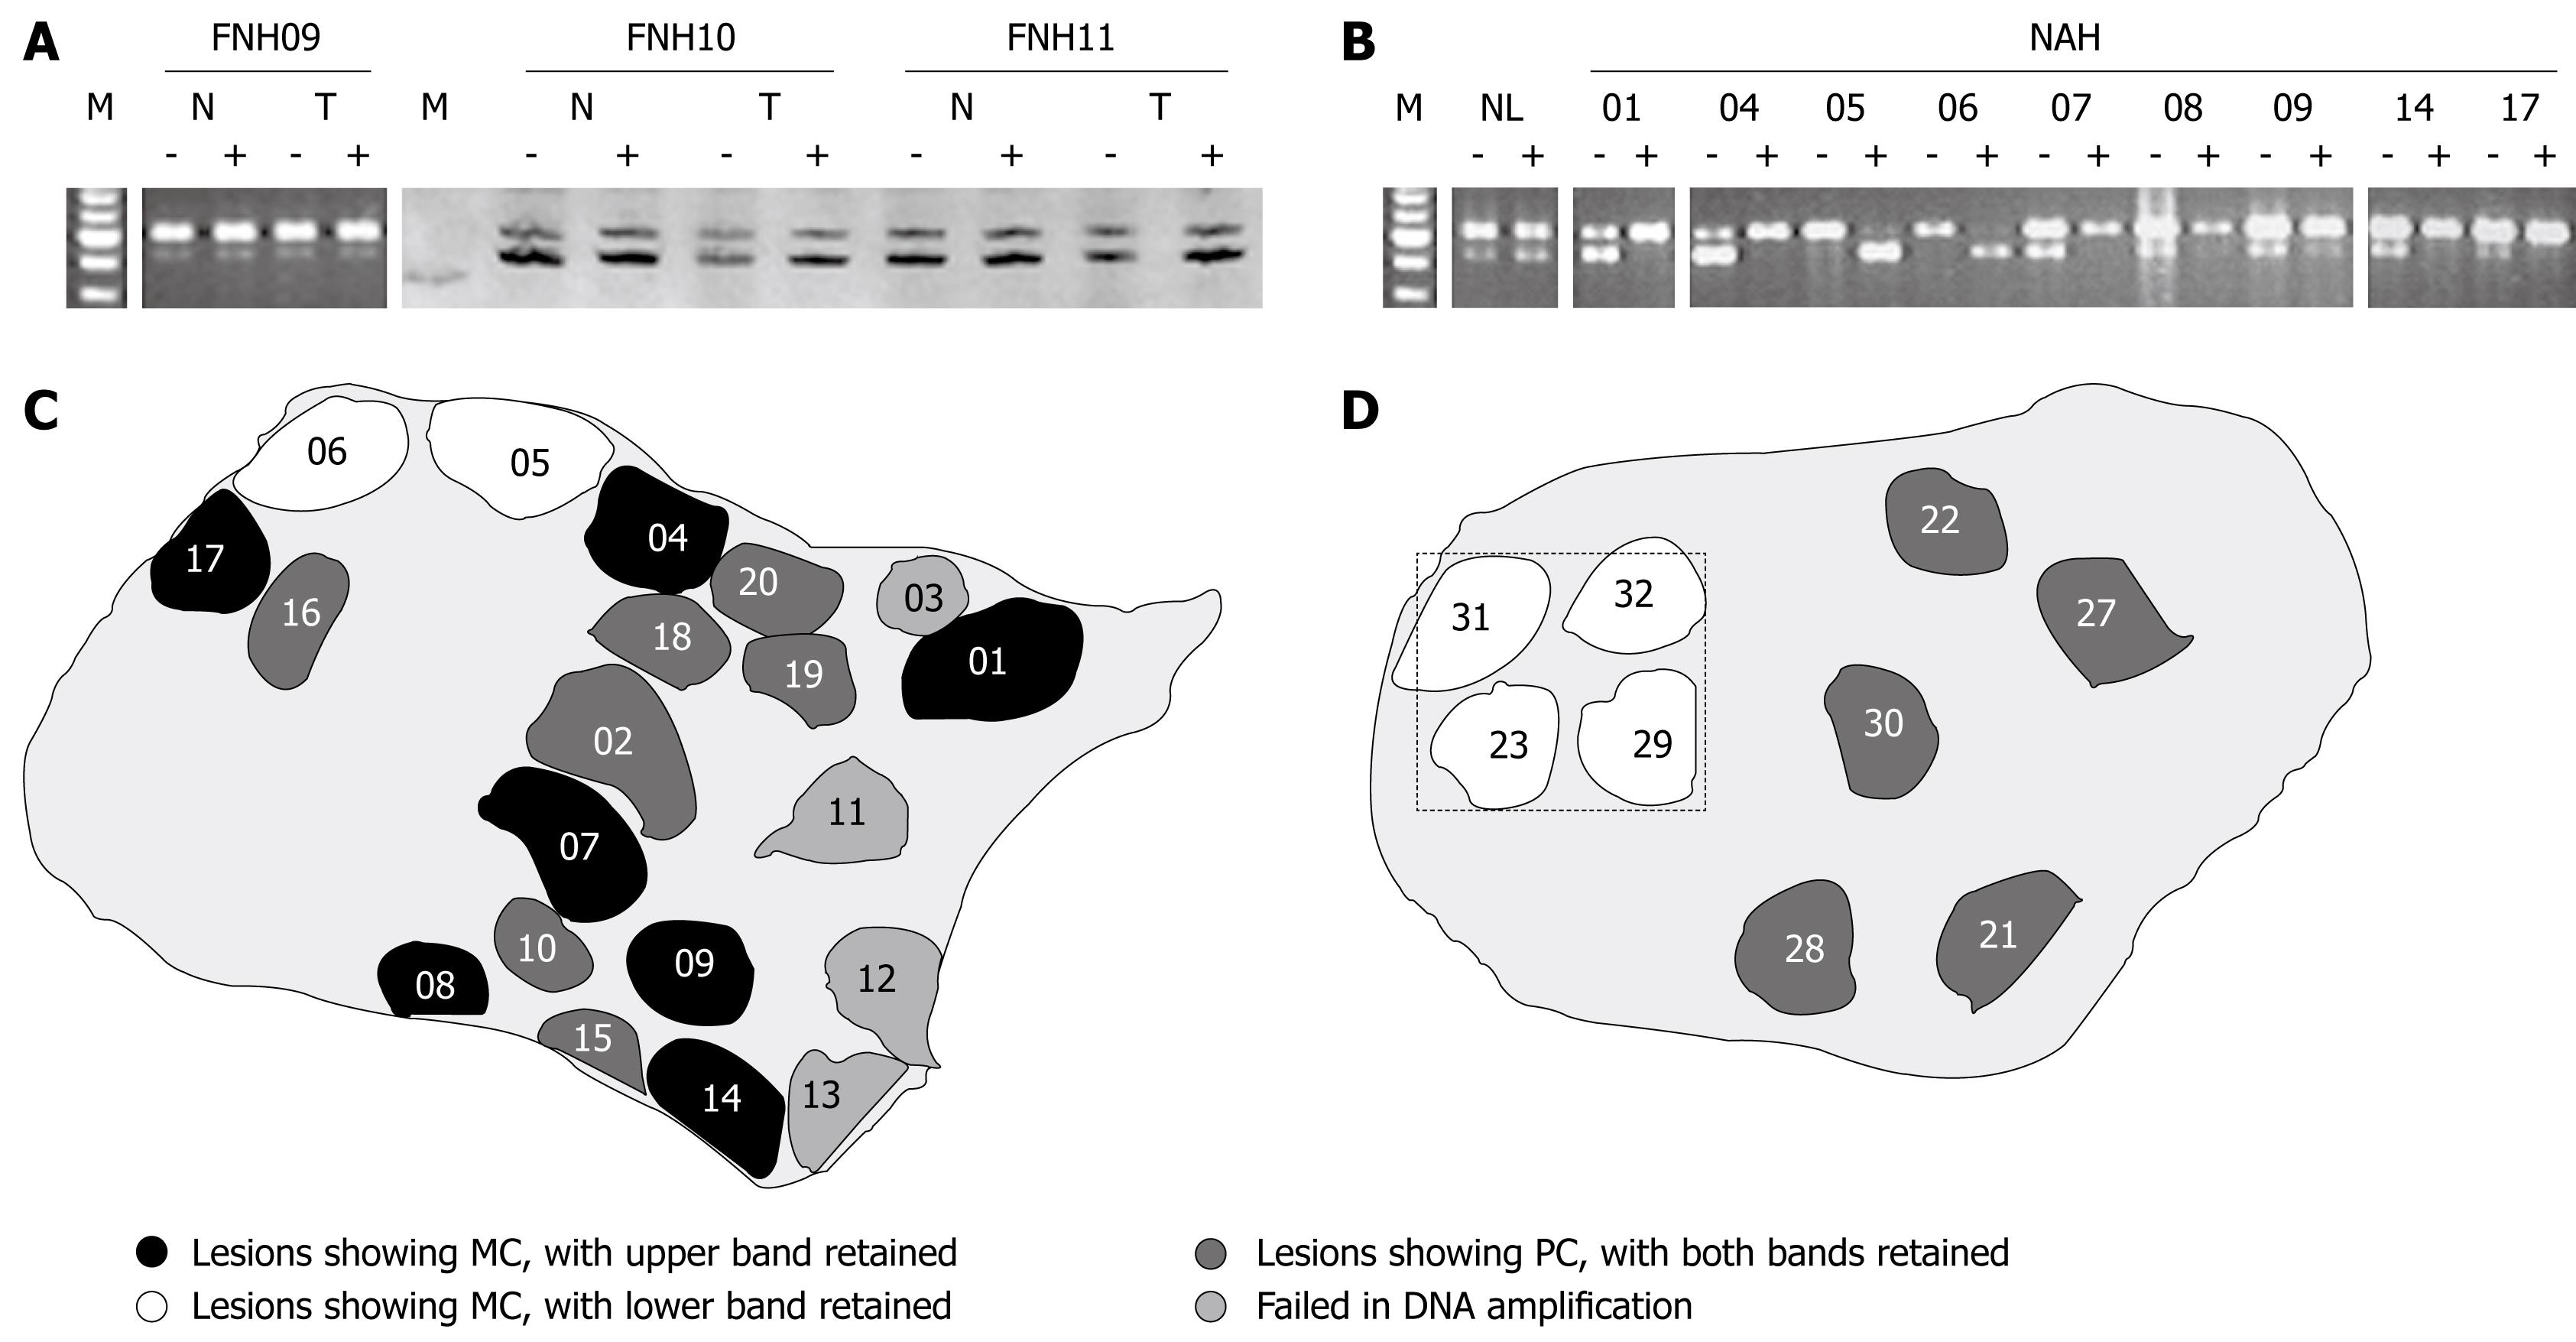
Figure 3 Clonality status of FNH lesions (A) and NAH (B), with XCI patterns revealed in different NAH (C and D).
A: Polyclonality (PC) revealed in 3 FNH lesions, with FNH09 assayed at PGK locus and 10 and 11 at AR locus. HpaII or HhaI pretreatment (-: Before; +: After) did not significantly change intensity ratios between the two bands of lesional tissues (T) compared to those of the surrounding liver parenchyma (N). M: DNA markers, with five bands at locations of 700, 600, 500, 400 and 300 bp for PGK assay, and a single band at the location of 200 bp for AR reaction; B: The PGK assay shows monoclonality (MC) in all of the nine NAH from FNH09, with the isolated reference tissue sample (NL), of a similar size to NAH, revealing polyclonality. XCI patterns of the NAH are different, with the upper band retained in NAH 01, 04, 07-09, 14 and 17, and the lower band retained in NAH 05 and 06; C: Sketch of a tissue section from FNH09, as illustrated in B, showing occurrence of monoclonal NAH with different XCI patterns and polyclonal lesions in the same section; D: Sketch of a tissue section from FNH11, showing four monoclonal and five polyclonal NAH. The clustered monoclonal lesions show the same XCI pattern, the XCI assays with small samples, as framed by hatch lines, may result in misinterpretation as monoclonality for the whole FNH lesion.
- Citation: Cai YR, Gong L, Teng XY, Zhang HT, Wang CF, Wei GL, Guo L, Ding F, Liu ZH, Pan QJ, Su Q. Clonality and allelotype analyses of focal nodular hyperplasia compared with hepatocellular adenoma and carcinoma. World J Gastroenterol 2009; 15(37): 4695-4708
- URL: https://www.wjgnet.com/1007-9327/full/v15/i37/4695.htm
- DOI: https://dx.doi.org/10.3748/wjg.15.4695


