Copyright
©2009 The WJG Press and Baishideng.
World J Gastroenterol. Aug 28, 2009; 15(32): 3992-3998
Published online Aug 28, 2009. doi: 10.3748/wjg.15.3992
Published online Aug 28, 2009. doi: 10.3748/wjg.15.3992
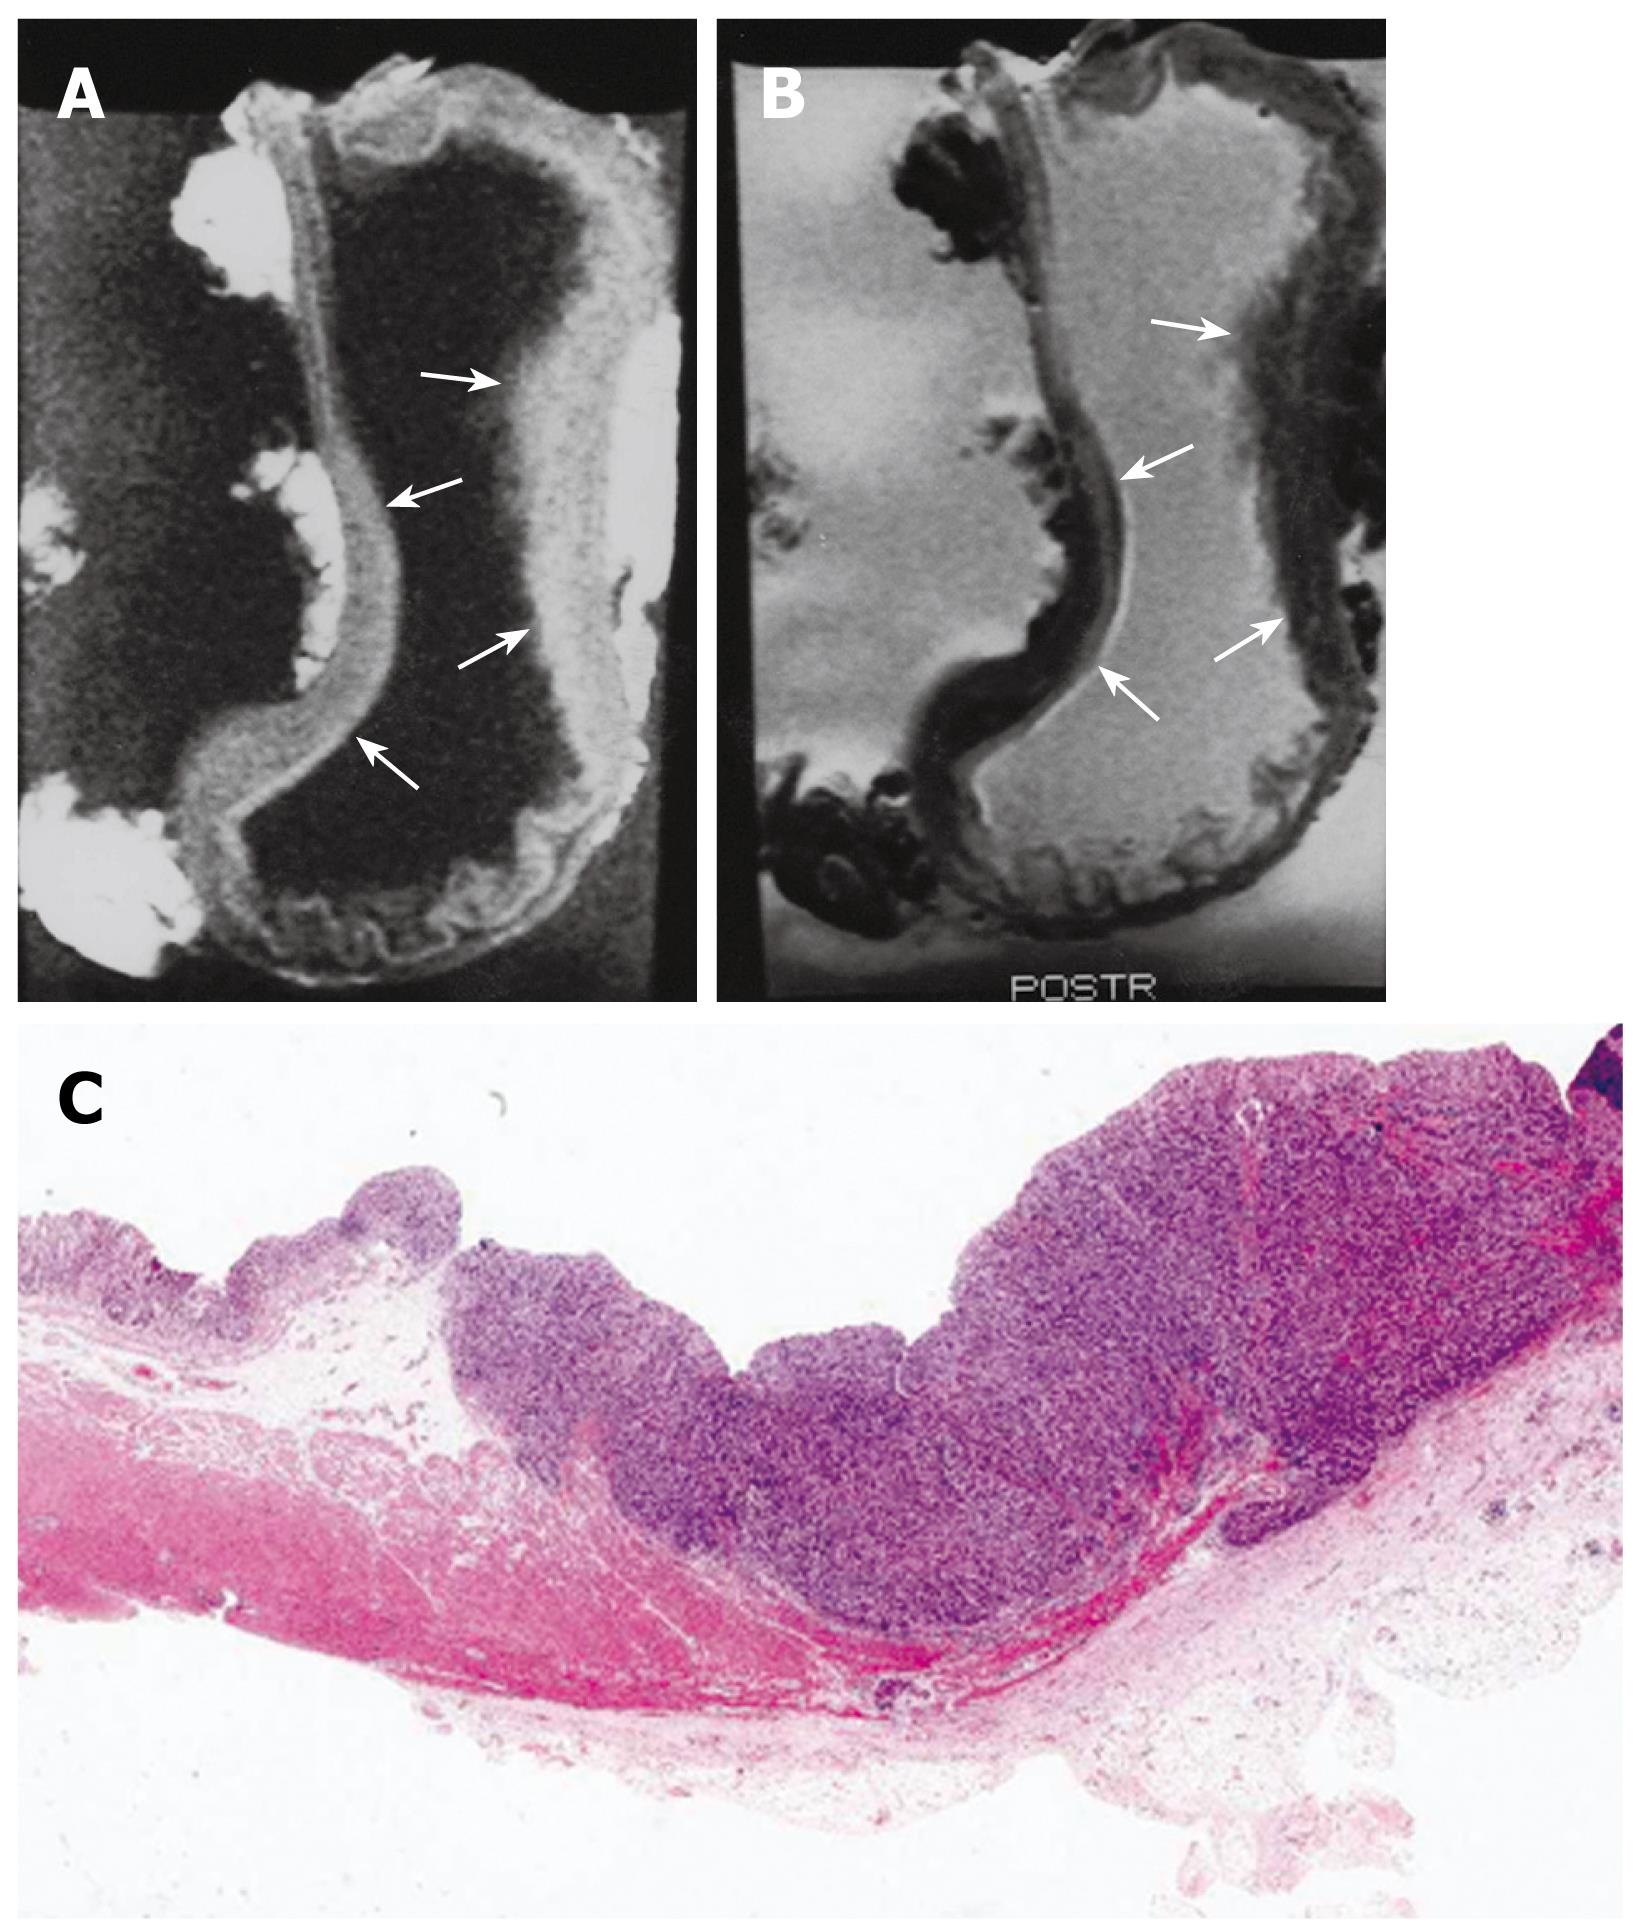
Figure 4 MRI and histology of T3 gastric adenocarcinoma.
A: T1-weighted (500/20) sagittal image showed thickening of gastric wall with all three layer SI change in lesser and greater curvature site of stomach body (arrows); B: T2-weighted (2000/90) sagittal MRI showed minimal increase of SI on lesion site and poor delineation of gastric wall SI at out layer margin compared to normal gastric wall (arrows); C: Light microscopic section showed extension of tumor invasion to serosal layer (HE stain; original magnification, × 1).
- Citation: Kim IY, Kim SW, Shin HC, Lee MS, Jeong DJ, Kim CJ, Kim YT. MRI of gastric carcinoma: Results of T and N-staging in an in vitro study. World J Gastroenterol 2009; 15(32): 3992-3998
- URL: https://www.wjgnet.com/1007-9327/full/v15/i32/3992.htm
- DOI: https://dx.doi.org/10.3748/wjg.15.3992


