Copyright
©2009 The WJG Press and Baishideng.
World J Gastroenterol. Aug 21, 2009; 15(31): 3874-3883
Published online Aug 21, 2009. doi: 10.3748/wjg.15.3874
Published online Aug 21, 2009. doi: 10.3748/wjg.15.3874
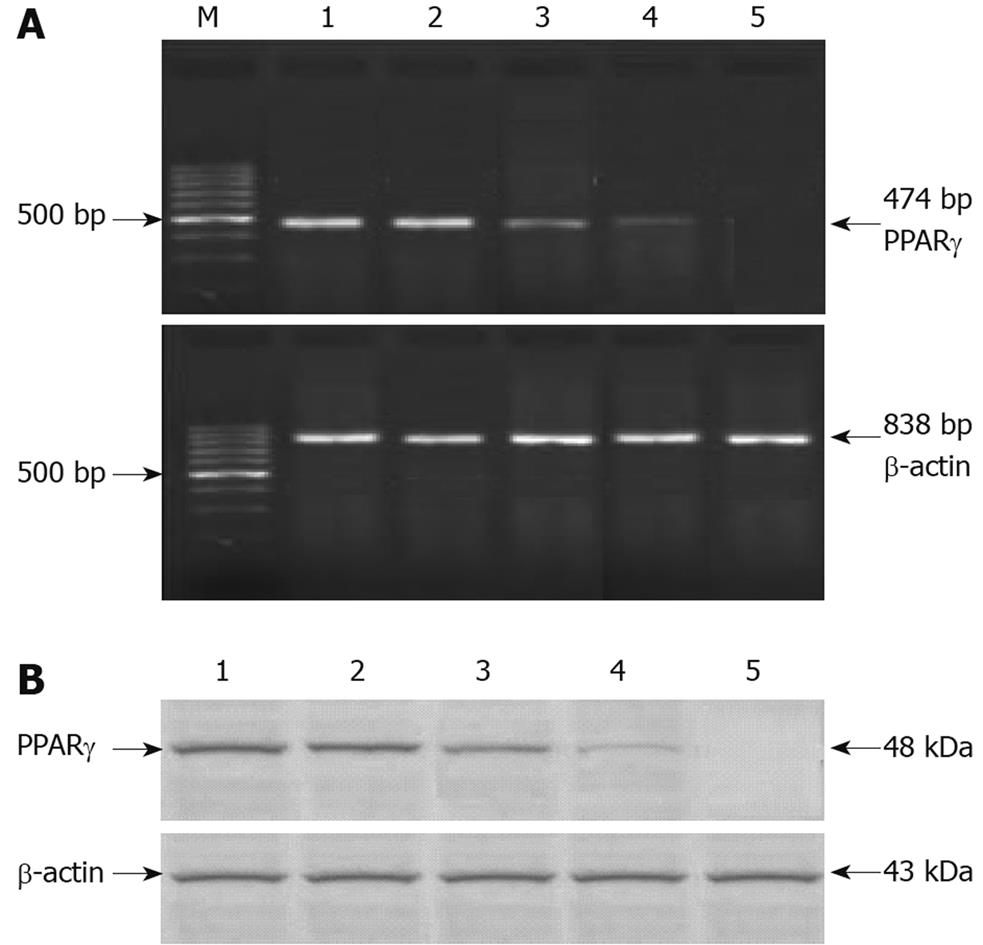
Figure 9 PPARγ after pSi transfection.
A: PPARγ mRNA expression in various cells detected by RT-PCR 48 h after transfection; B: PPARγ protein expression in various cells 48 h after transfection as detected by Western blotting. Lane M: 100 bp DNA marker, 500 bp was the brightest; Lane 1: MGC803-N (normal MGC803 cells); Lane 2: MGC803-HK (MGC803 cells transfected by empty vector); Lane 3: MGC803-pSi3 (MGC803 cells transfected by pSi3 vector); Lane 4: MGC803-pSi2 (MGC803 cells transfected by pSi2 vector); Lane 5: MGC803-pSi1 (MGC803 cells transfected by pSi1 vector). The effect of pSi1 was best in silencing PPAR-γ mRNA and protein expression in MGC803 cells.
- Citation: Ma XM, Yu H, Huai N. Peroxisome proliferator-activated receptor-γ is essential in the pathogenesis of gastric carcinoma. World J Gastroenterol 2009; 15(31): 3874-3883
- URL: https://www.wjgnet.com/1007-9327/full/v15/i31/3874.htm
- DOI: https://dx.doi.org/10.3748/wjg.15.3874


