Copyright
©2009 The WJG Press and Baishideng.
World J Gastroenterol. Aug 14, 2009; 15(30): 3799-3806
Published online Aug 14, 2009. doi: 10.3748/wjg.15.3799
Published online Aug 14, 2009. doi: 10.3748/wjg.15.3799
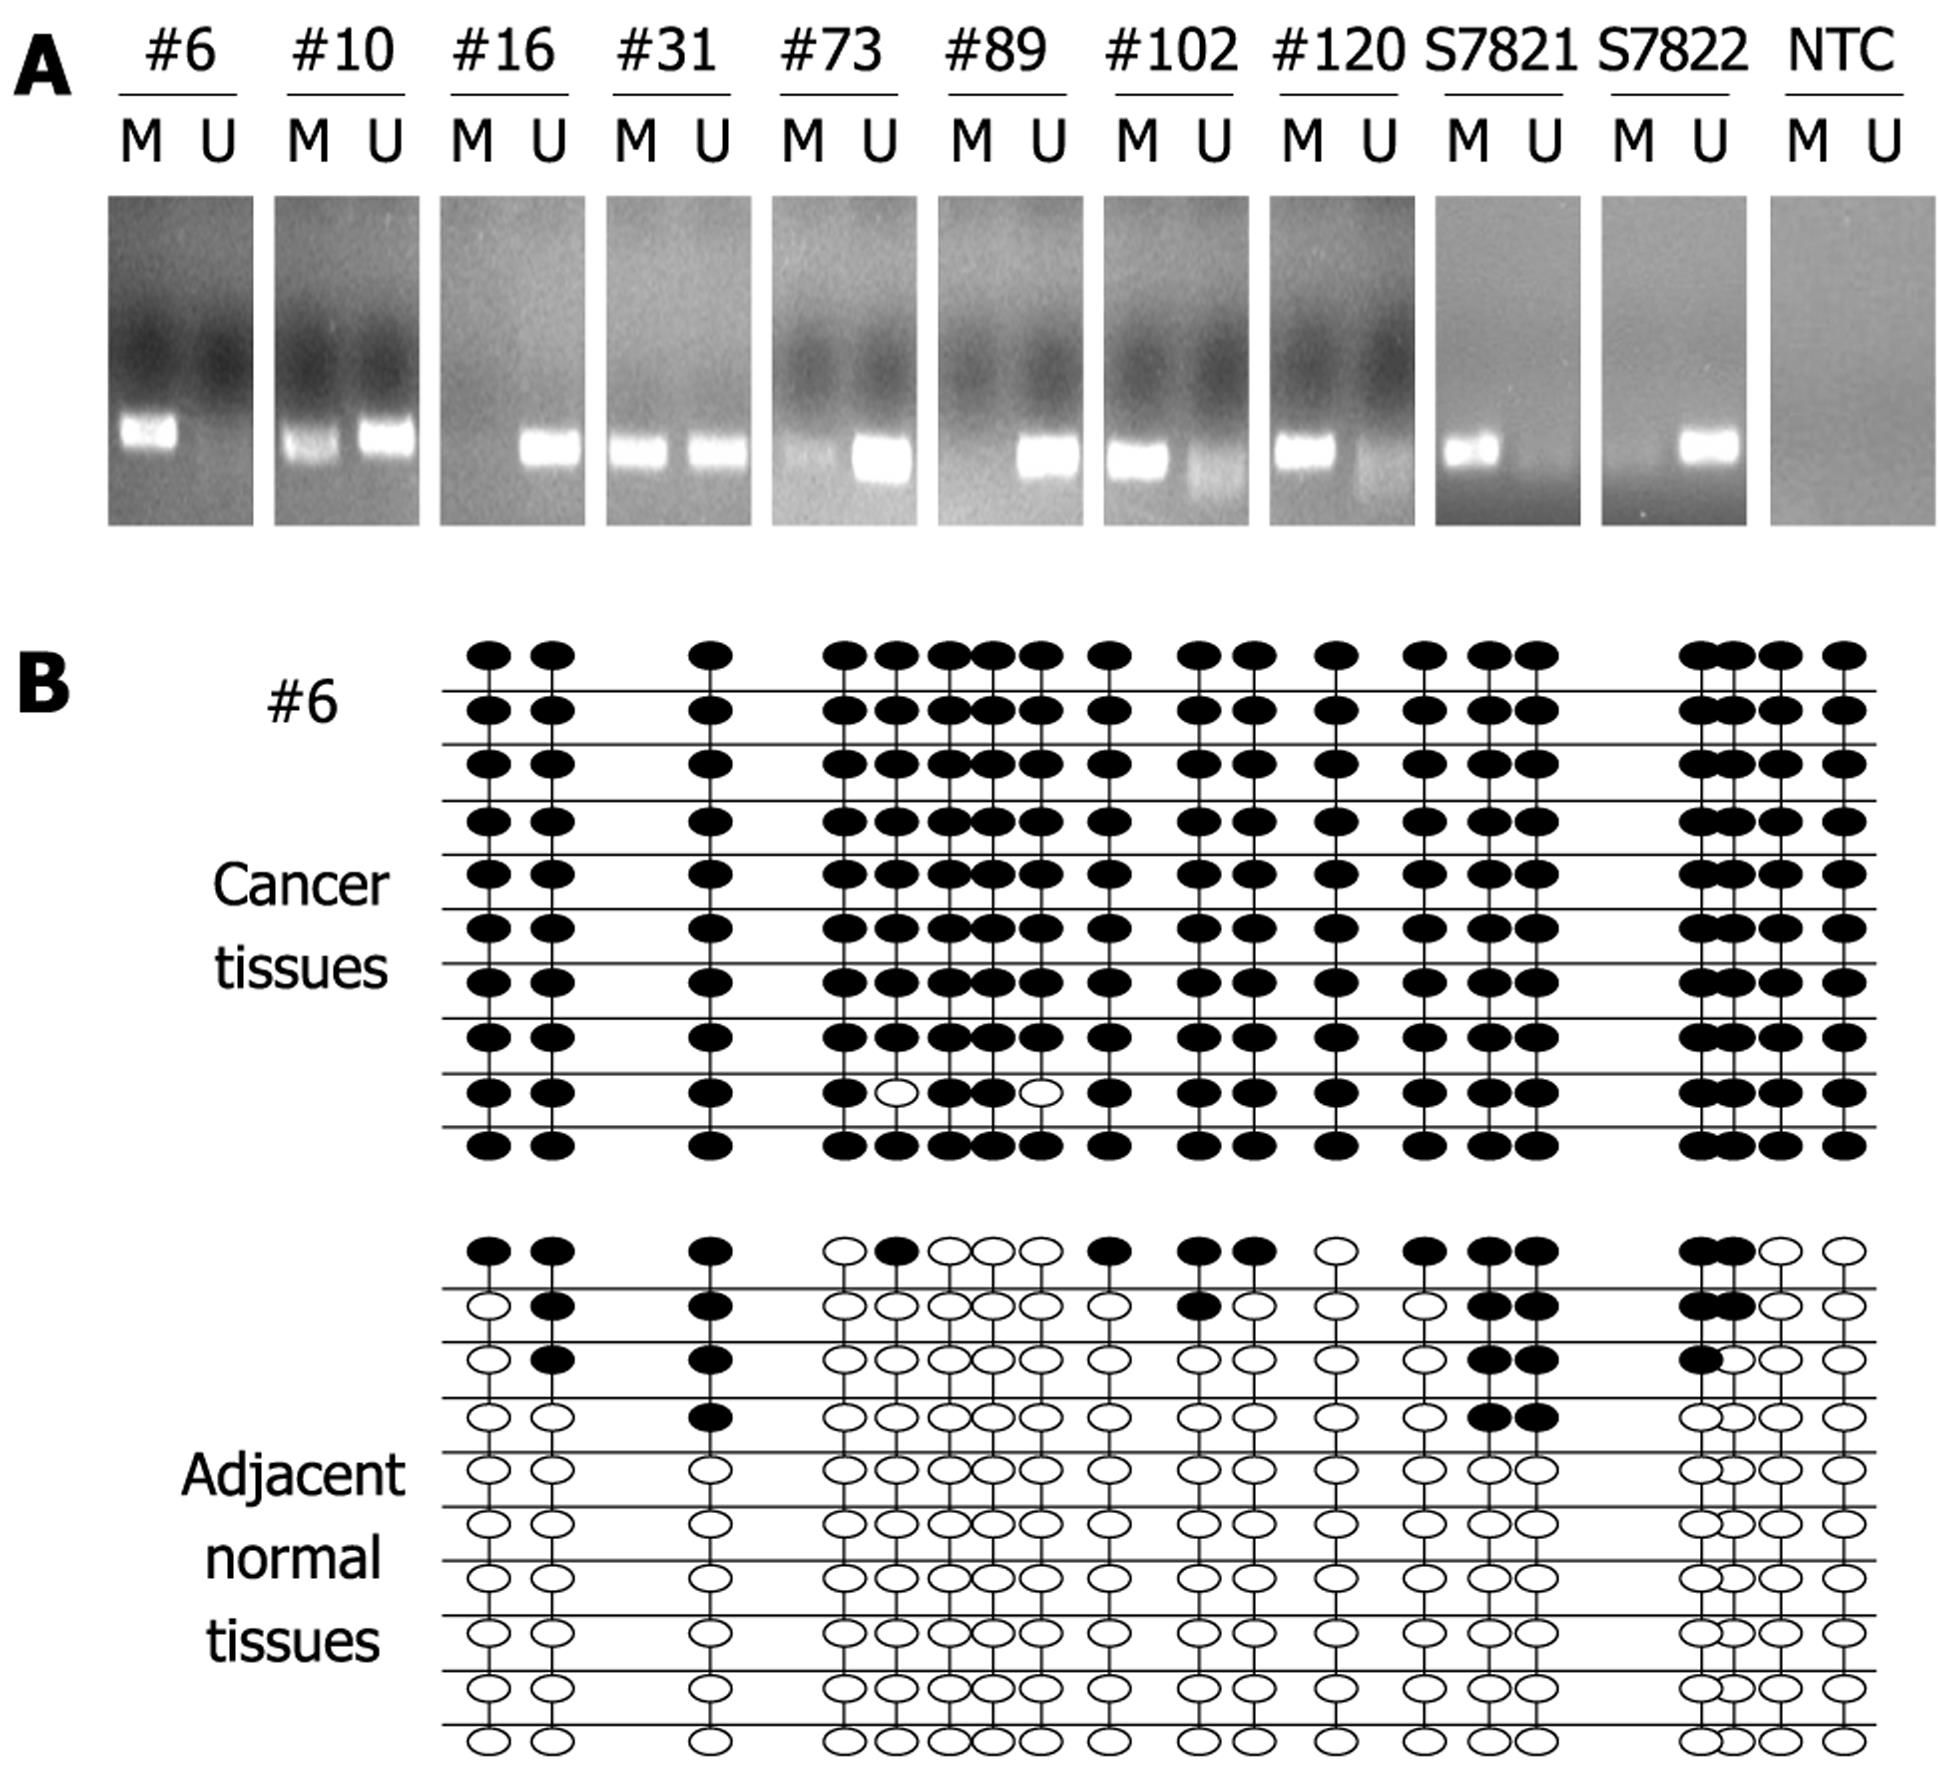
Figure 2 Methylation of PTCH1a TRR in gastric cancer tissues.
A: Methylation of PTCH1a TRR in gastric cancer tissues (n = 170) using MSP. MSP results from eight representative patients (#) are shown. The DNA bands in lanes labeled with M represent the products amplified with the methylation-specific primers, while DNA bands labeled with U represent the products amplified with the non-methylation-specific primers. CpGenome Universal Methylated DNA (S7821) and the CpGenome Universal Unmethylated DNA (s7822) were used as controls for methylation and non-methylation. Water was used as non-template control (NTC); B: Genomic DNA of gastric cancer tissues and its corresponding normal tissues from a representative patient (#6) was analyzed by BSP. Methylation patterns of the 19 CpG sites contained in the BSP amplicon through 10 clone sequence analyses in cancer tissues, and corresponding normal tissues are shown. Black dot, methylation; white dot, non-methylation.
- Citation: Du P, Ye HR, Gao J, Chen W, Wang ZC, Jiang HH, Xu J, Zhang JW, Zhang JC, Cui L. Methylation of PTCH1a gene in a subset of gastric cancers. World J Gastroenterol 2009; 15(30): 3799-3806
- URL: https://www.wjgnet.com/1007-9327/full/v15/i30/3799.htm
- DOI: https://dx.doi.org/10.3748/wjg.15.3799


