Copyright
©2009 The WJG Press and Baishideng.
World J Gastroenterol. Aug 14, 2009; 15(30): 3799-3806
Published online Aug 14, 2009. doi: 10.3748/wjg.15.3799
Published online Aug 14, 2009. doi: 10.3748/wjg.15.3799
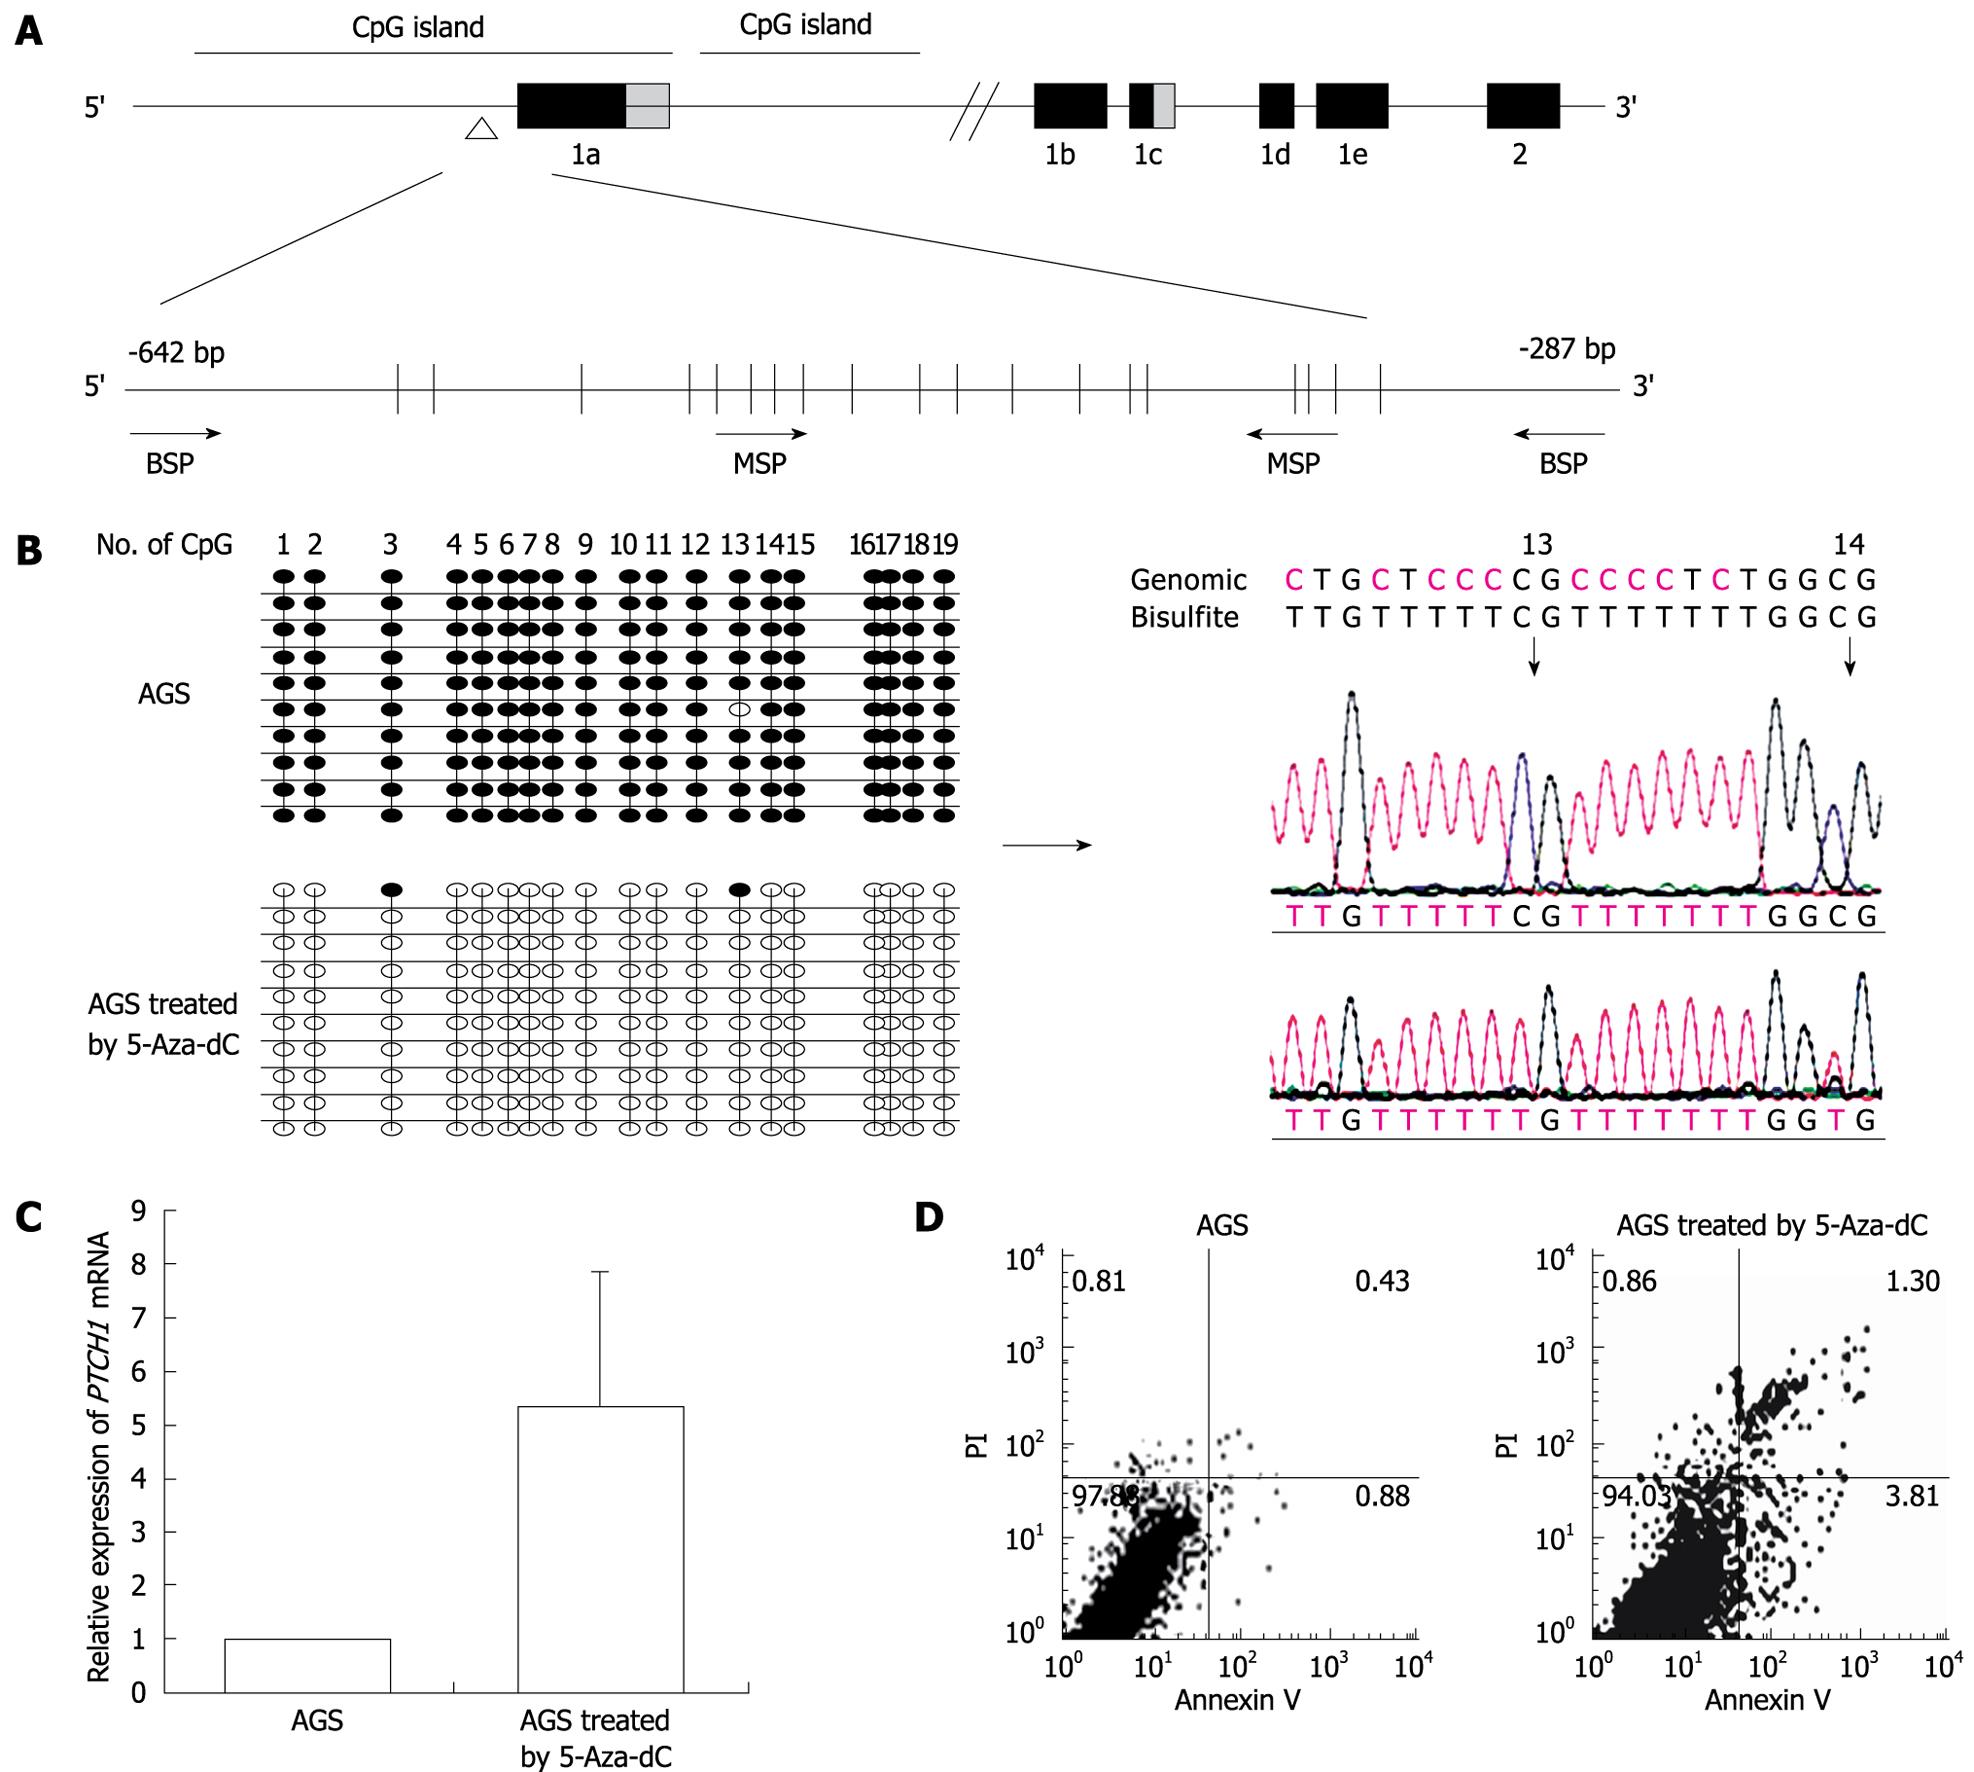
Figure 1 Analysis of methylation and expression of PTCH1a in gastric cancer cell line AGS.
A: Illustration of PTCH1a TRR and topology of MSP and BSP primers. BSP detection region contained 19 CpG sites, and MSP up-primer and down-primer contained four and three CpG sites, respectively. The detection amplicon is indicated by the empty triangle; B: Alteration of PTCH1a TRR methylation in gastric cancer cell line AGS treated with 5-Aza-dC. Genomic DNA from untreated AGS cells and those treated with 5-Aza-dC (1 μmol/L) were analyzed by BSP at day 4. The left column indicates alterations of the 19 CpG sites contained in the BSP amplicon through 10 cloned sequences after 5-Aza-dC treatment. The right column displays part of the sequence of the methylated and unmethylated clones. Black dot, methylated; white dot, unmethylated; C: Alteration of PTCH1 expression in gastric cancer cell line AGS treated with 5-Aza-dC. PTCH1 gene expression in AGS cells treated with 5-Aza-dC (1 μmol/L) at day 4 was detected by real-time PCR relative to untreated AGS cells. Expression of PTCH1 gene was enhanced significantly in the treated AGS cells compared with untreated (P < 0.01, n = 3, independent tests). Box, mean; bar, SD; D: Analysis of apoptosis of AGS cells treated with 5-Aza-dC. The rate of apoptosis in AGS cells treated with 5-Aza-dC (1 μmol/L) at day 4 was significantly higher compared to untreated cells (P < 0.01, n = 3). The representative analysis of AGS cell apoptosis by annexin V/PI method is shown.
- Citation: Du P, Ye HR, Gao J, Chen W, Wang ZC, Jiang HH, Xu J, Zhang JW, Zhang JC, Cui L. Methylation of PTCH1a gene in a subset of gastric cancers. World J Gastroenterol 2009; 15(30): 3799-3806
- URL: https://www.wjgnet.com/1007-9327/full/v15/i30/3799.htm
- DOI: https://dx.doi.org/10.3748/wjg.15.3799


