Copyright
©2009 The WJG Press and Baishideng.
World J Gastroenterol. Jan 21, 2009; 15(3): 321-327
Published online Jan 21, 2009. doi: 10.3748/wjg.15.321
Published online Jan 21, 2009. doi: 10.3748/wjg.15.321
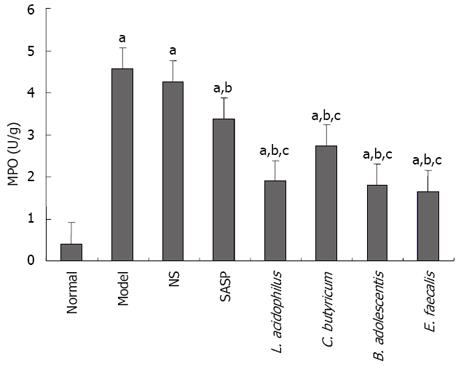
Figure 6 MPO activity in normal group (0.
399 ± 0.133 U/g compared with normal group, model group and SASP treatment group. aP < 0.05 vs normal group, bP < 0.05 vs model group, cP < 0.05 vs SASP treatment group.
- Citation: Chen LL, Wang XH, Cui Y, Lian GH, Zhang J, Ouyang CH, Lu FG. Therapeutic effects of four strains of probiotics on experimental colitis in mice. World J Gastroenterol 2009; 15(3): 321-327
- URL: https://www.wjgnet.com/1007-9327/full/v15/i3/321.htm
- DOI: https://dx.doi.org/10.3748/wjg.15.321


