Copyright
©2009 The WJG Press and Baishideng.
World J Gastroenterol. Jan 21, 2009; 15(3): 300-309
Published online Jan 21, 2009. doi: 10.3748/wjg.15.300
Published online Jan 21, 2009. doi: 10.3748/wjg.15.300
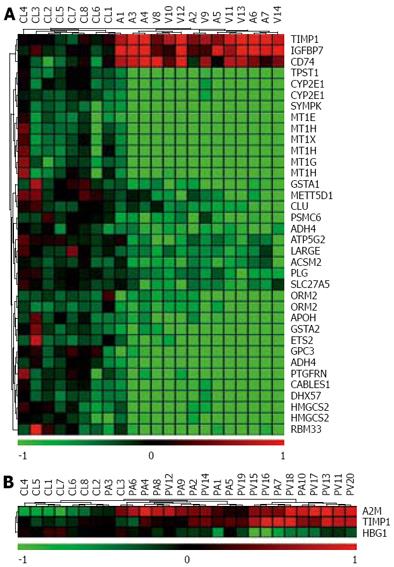
Figure 1 Clustering of cirrhosis from comparisons of transcript levels vs Cls.
Every transcript level expressed as a [level per patient/median level in CLs] was measured by microarray. The samples are shown as a dendrogram on top and the transcripts are listed vertically. Bottom scale bar (log2 scale): decreased (green), increased (red) or unchanged (black) transcript level. A: UHC was made in 14 HCC-free cirrhosis samples and 8 CLs, from 30 transcript levels first identified as cirrhosis markers in an HCC-free context. B: UHC was made with 20 peritumoral cirrhosis samples and 8 CLs, from 3 transcript levels identified as cirrhosis markers in an HCC context.
- Citation: Caillot F, Derambure C, Bioulac-Sage P, François A, Scotte M, Goria O, Hiron M, Daveau M, Salier JP. Transient and etiology-related transcription regulation in cirrhosis prior to hepatocellular carcinoma occurrence. World J Gastroenterol 2009; 15(3): 300-309
- URL: https://www.wjgnet.com/1007-9327/full/v15/i3/300.htm
- DOI: https://dx.doi.org/10.3748/wjg.15.300


