Copyright
©2009 The WJG Press and Baishideng.
World J Gastroenterol. Aug 7, 2009; 15(29): 3603-3610
Published online Aug 7, 2009. doi: 10.3748/wjg.15.3603
Published online Aug 7, 2009. doi: 10.3748/wjg.15.3603
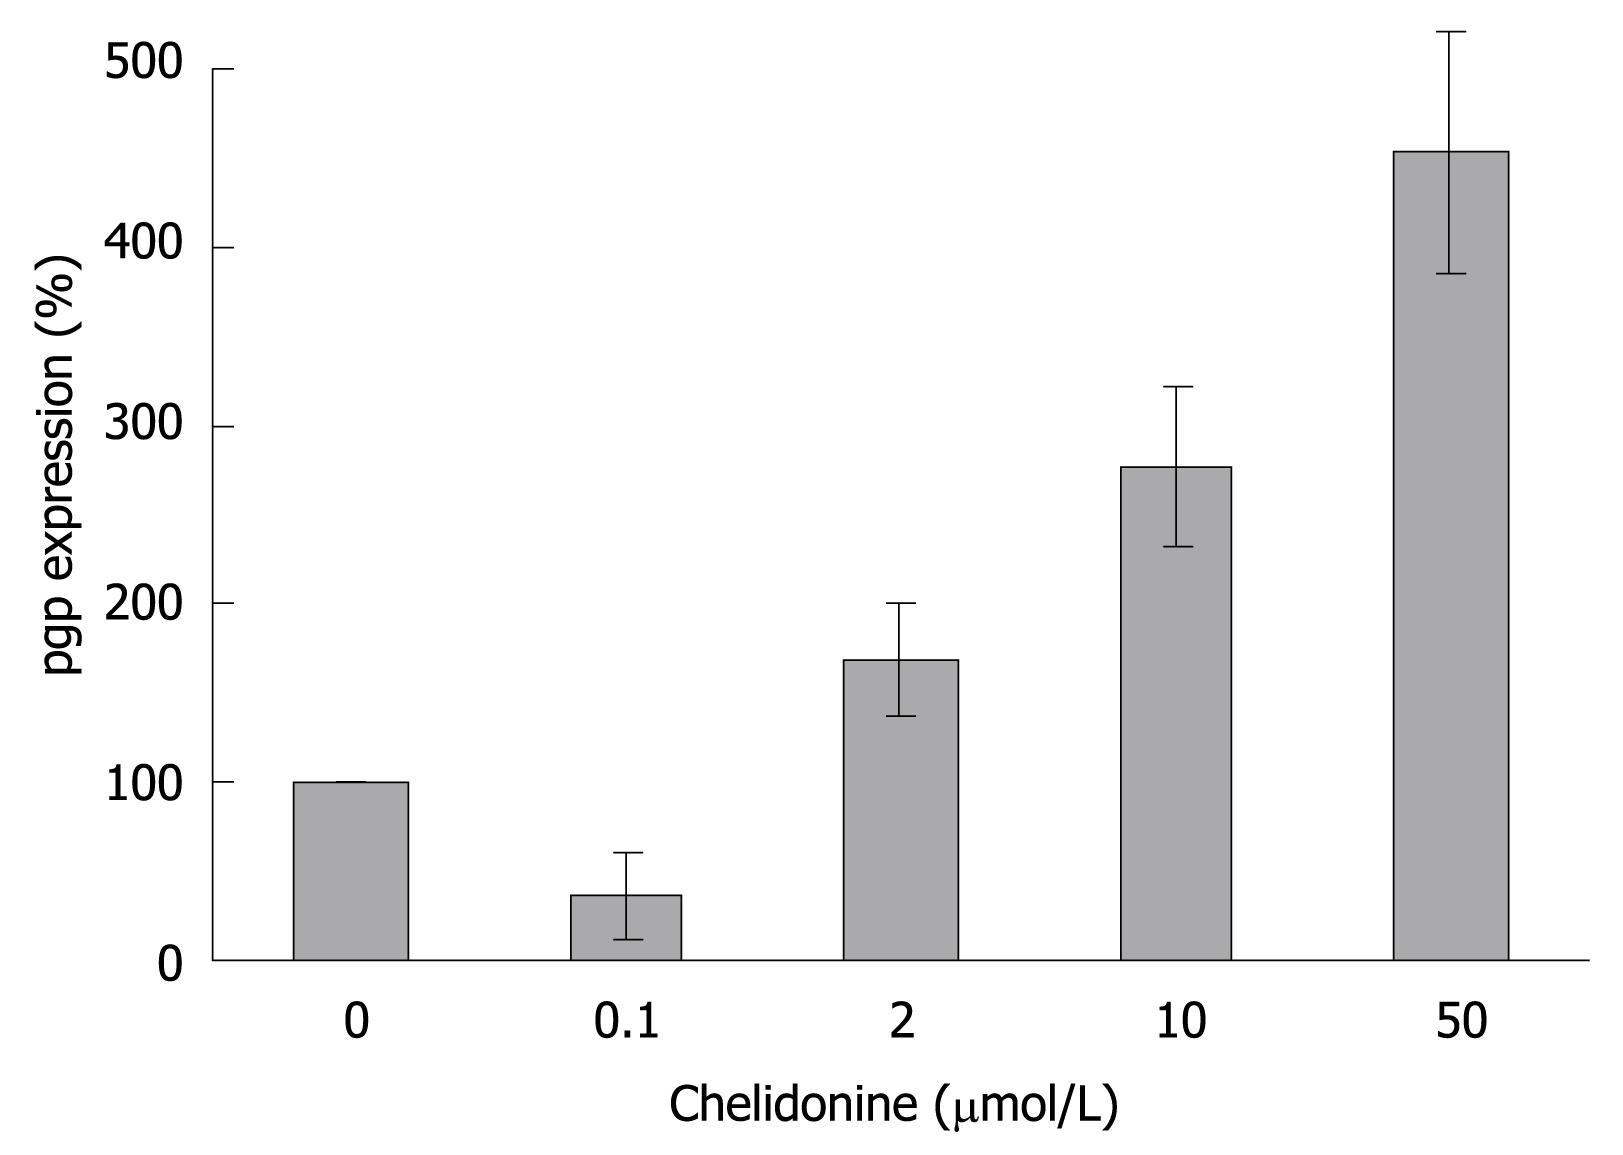
Figure 9 Relative expression level of P-glycoprotein in HepG2 cells 48 h after treatment with different concentrations of chelidonine.
Each bar indicates the mean ± SD (n = 3).
- Citation: Kazemi Noureini S, Wink M. Transcriptional down regulation of hTERT and senescence induction in HepG2 cells by chelidonine. World J Gastroenterol 2009; 15(29): 3603-3610
- URL: https://www.wjgnet.com/1007-9327/full/v15/i29/3603.htm
- DOI: https://dx.doi.org/10.3748/wjg.15.3603


