Copyright
©2009 The WJG Press and Baishideng.
World J Gastroenterol. Aug 7, 2009; 15(29): 3603-3610
Published online Aug 7, 2009. doi: 10.3748/wjg.15.3603
Published online Aug 7, 2009. doi: 10.3748/wjg.15.3603
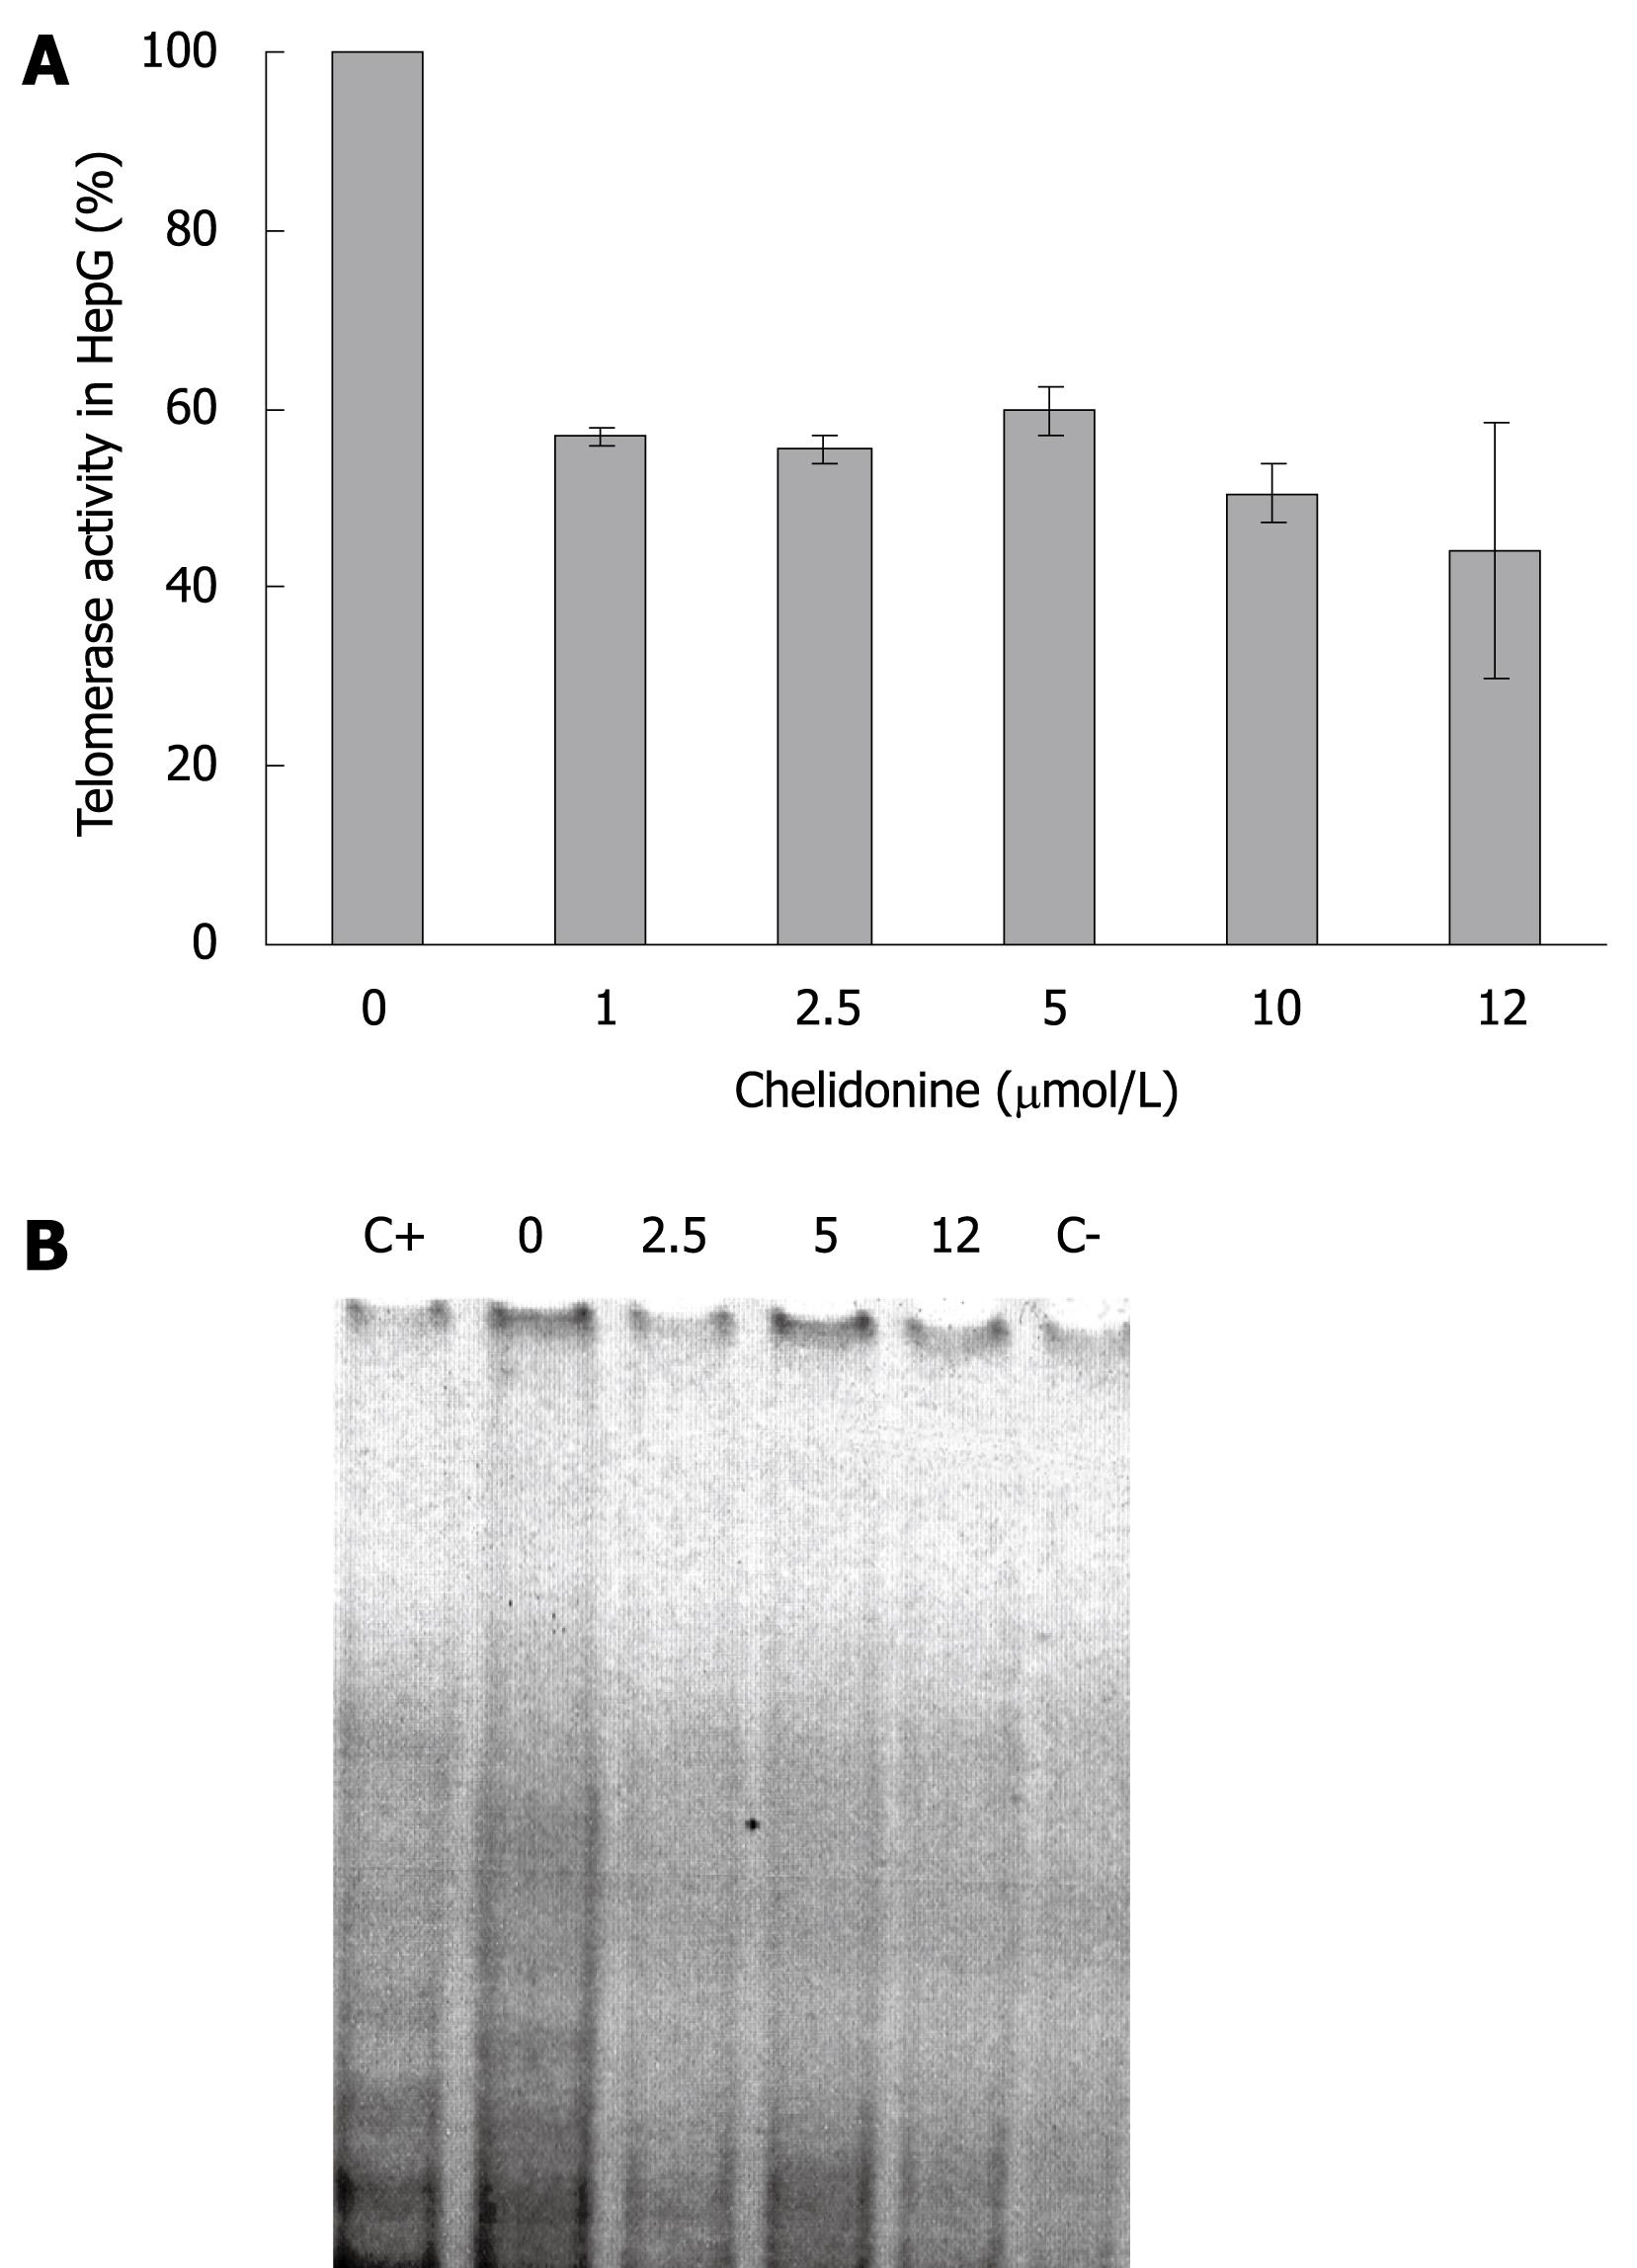
Figure 4 Telomerase activity using TRAP assay in HepG2 control and 48 h treated cells with different concentration of chelidonine up to LD50.
A: The relative activity of treated cells against untreated control cells are indicated as mean ± SD; B: TRAP products resolved on non-denaturing PAGE and stained with SYBR Green. The concentration of chelidonine is indicated on top of each well in μmol/L. C+: Positive control; C-: Negative control.
- Citation: Kazemi Noureini S, Wink M. Transcriptional down regulation of hTERT and senescence induction in HepG2 cells by chelidonine. World J Gastroenterol 2009; 15(29): 3603-3610
- URL: https://www.wjgnet.com/1007-9327/full/v15/i29/3603.htm
- DOI: https://dx.doi.org/10.3748/wjg.15.3603


