Copyright
©2009 The WJG Press and Baishideng.
World J Gastroenterol. Jul 21, 2009; 15(27): 3382-3393
Published online Jul 21, 2009. doi: 10.3748/wjg.15.3382
Published online Jul 21, 2009. doi: 10.3748/wjg.15.3382
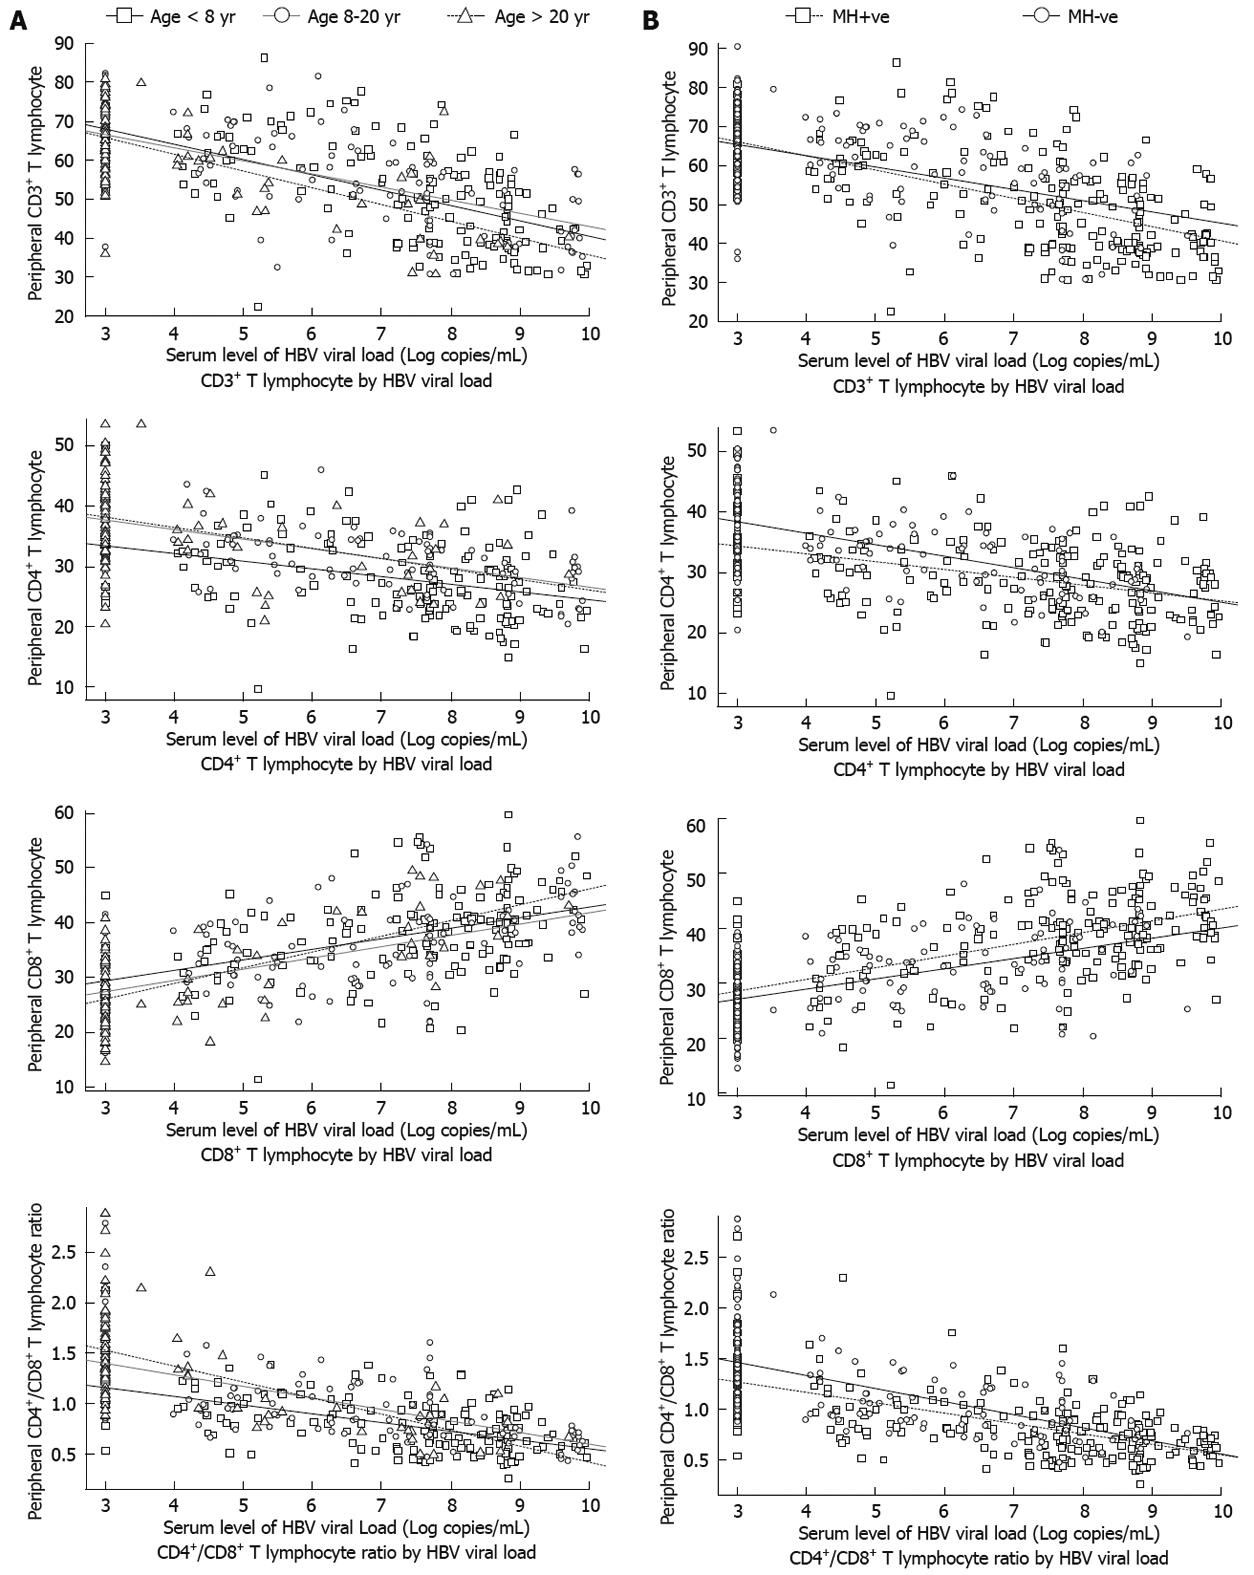
Figure 4 Correlation between T-cell subsets and HBV load stratified by age at HBV infection (A) and maternal HBV infection status (B).
Three regression lines (with different slopes) were drawn for patients at different ages of HBV infection. The coefficient of the interaction term “HBVDNA: age-at-HBV-infection” was not statistically significant for each parameter of T lymphocyte subpopulations (P > 0.05). A similar pattern was seen when stratified by maternal HBV infection status.
- Citation: You J, Zhuang L, Zhang YF, Chen HY, Sriplung H, Geater A, Chongsuvivatwong V, Piratvisuth T, McNeil E, Yu L, Tang BZ, Huang JH. Peripheral T-lymphocyte subpopulations in different clinical stages of chronic HBV infection correlate with HBV load. World J Gastroenterol 2009; 15(27): 3382-3393
- URL: https://www.wjgnet.com/1007-9327/full/v15/i27/3382.htm
- DOI: https://dx.doi.org/10.3748/wjg.15.3382


