Copyright
©2009 The WJG Press and Baishideng.
World J Gastroenterol. Jul 21, 2009; 15(27): 3382-3393
Published online Jul 21, 2009. doi: 10.3748/wjg.15.3382
Published online Jul 21, 2009. doi: 10.3748/wjg.15.3382
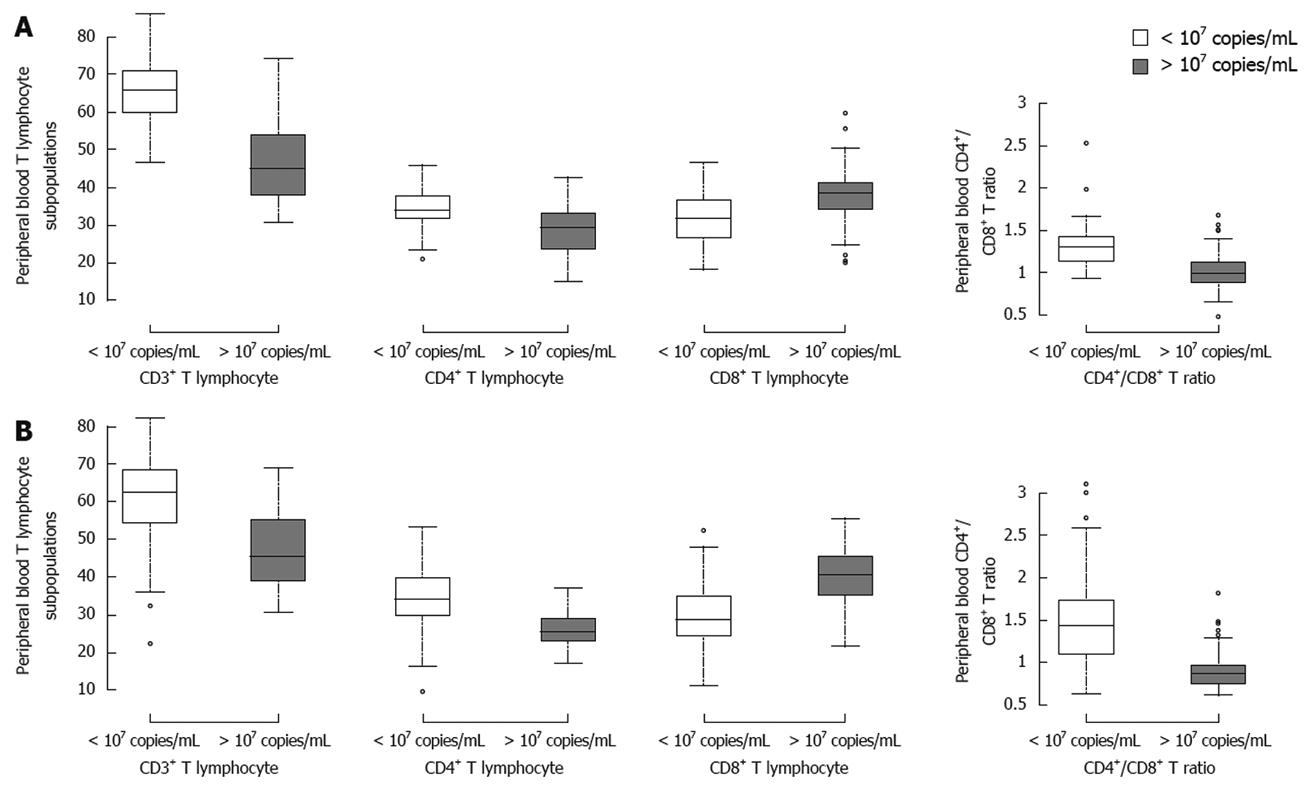
Figure 2 Mean percentages of CD3+, CD4+ and CD8+ T-cells in patients at immune-tolerant stage (A) and immune active stage (B) of chronic HBV infection.
Patients were divided into two groups based upon HBV DNA load. The proportion of CD8+ T-cells was significantly higher in patients with a high HBV load than in patients with a low HBV load at the immune-tolerant stage (38.66 ± 7.11 vs 31.50 ± 6.40, P < 0.001) and at the immune active stage (40.07 ± 7.55 vs 30.11 ± 7.69, P < 0.001). The percentage of CD4+ T-cells was significantly higher in patients with a low HBV load than in patients with a high HBV load at the immune-tolerant stage (33.77 ± 5.81 vs 29.05 ± 6.11, P < 0.001) and at the immune active stage (34.41 ± 7.23 vs 26.25 ± 4.52, P < 0.001). Significant differences were found in CD3+ T-cells and CD4+/CD8+ ratio between patients with a high HBV load and a low HBV load at the immune-tolerant stage (45.90 ± 10.69 vs 65.40 ± 8.70, 0.78 ± 0.21 vs 1.11 ± 0.32, P < 0.001) and at the immune active stage (46.82 ± 9.25 vs 62.01 ± 10.52, 0.69 ± 0.23 vs 1.24 ± 0.47, P < 0.001). CD8+ T-cells were predominant compared with CD4+ T-cells in patients with a high HBV load, whereas CD4+ T-cells were predominant compared with CD8+ T-cells in patients with a low HBV load.
- Citation: You J, Zhuang L, Zhang YF, Chen HY, Sriplung H, Geater A, Chongsuvivatwong V, Piratvisuth T, McNeil E, Yu L, Tang BZ, Huang JH. Peripheral T-lymphocyte subpopulations in different clinical stages of chronic HBV infection correlate with HBV load. World J Gastroenterol 2009; 15(27): 3382-3393
- URL: https://www.wjgnet.com/1007-9327/full/v15/i27/3382.htm
- DOI: https://dx.doi.org/10.3748/wjg.15.3382


