Copyright
©2009 The WJG Press and Baishideng.
World J Gastroenterol. Jul 14, 2009; 15(26): 3246-3253
Published online Jul 14, 2009. doi: 10.3748/wjg.15.3246
Published online Jul 14, 2009. doi: 10.3748/wjg.15.3246
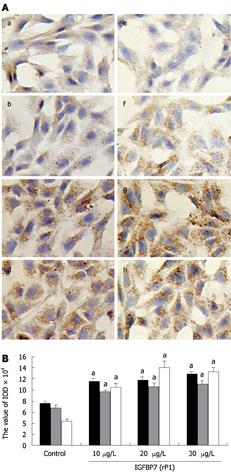
Figure 3 Comparison of fibronectin levels and fibroblast phenotype.
A: Characterization of α-SMA and fibronectin. Immunocytochemistry was performed on HSC after incubation with IGFBP-7 at different concentrations (0, 10 &mgr;g/L, 20 &mgr;g/L and 30 &mgr;g/L) for 24 h. α-SMA (a-e) and fibronectin (f-i) were examined by immunocytochemistry. The amount of the expression of α-SMA (b-d) and fibronectin (f-h) were enhanced in a dose-dependent manner in sequence compared with the control group (a, e). Original magnification: × 200. B: Comparison of the expression of collagen I, fibronectin and α-SMA at different concentrations. The expression of collagen I, fibronectin and α-SMA was detected through immunocytochemistry, and the value of IOD of the positive-brown particles was calculated. The black, gray and white bars represents the IOD value of α-SMA, collagen I and fibronectin, respectively. Statistical analysis was done using the SNK-q test. aP < 0.05.
-
Citation: Liu LX, Huang S, Zhang QQ, Liu Y, Zhang DM, Guo XH, Han DW. Insulin-like growth factor binding protein-7 induces activation and transdifferentiation of hepatic stellate cells
in vitro . World J Gastroenterol 2009; 15(26): 3246-3253 - URL: https://www.wjgnet.com/1007-9327/full/v15/i26/3246.htm
- DOI: https://dx.doi.org/10.3748/wjg.15.3246


