Copyright
©2009 The WJG Press and Baishideng.
World J Gastroenterol. Jul 14, 2009; 15(26): 3240-3245
Published online Jul 14, 2009. doi: 10.3748/wjg.15.3240
Published online Jul 14, 2009. doi: 10.3748/wjg.15.3240
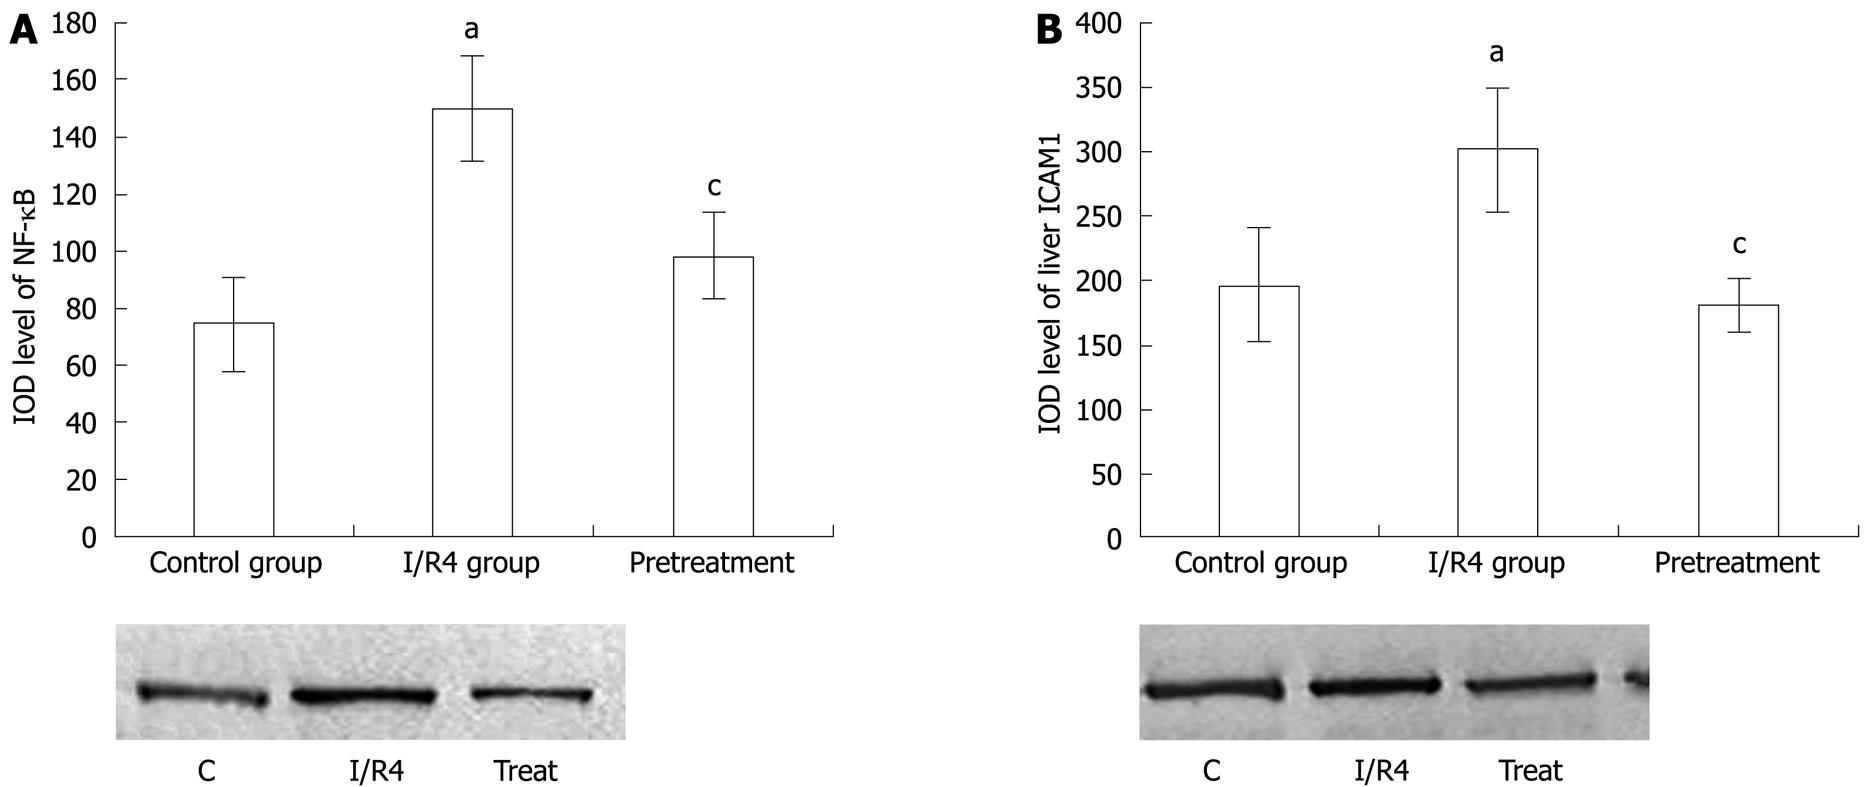
Figure 4 IOD level of western blotting analysis of liver NF-κB p65 (A) and ICAM-1 (B) in the control, intestinal I/R (1 h ischemia and 4 h reperfusion) and carnosol pretreatment groups (carnosol 3 mg/kg intraperitoneal administration).
Data are expressed as mean ± SD. aP < 0.05 vs control group; cP < 0.05 vs I/R group.
- Citation: Yao JH, Zhang XS, Zheng SS, Li YH, Wang LM, Wang ZZ, Chu L, Hu XW, Liu KX, Tian XF. Prophylaxis with carnosol attenuates liver injury induced by intestinal ischemia/reperfusion. World J Gastroenterol 2009; 15(26): 3240-3245
- URL: https://www.wjgnet.com/1007-9327/full/v15/i26/3240.htm
- DOI: https://dx.doi.org/10.3748/wjg.15.3240


